Eliminate Carbon Emissions (ECE) Pvt. Ltd was contracted by the IPL Management upon the recommendation of the United Nations Environment Program (UNEP) to calculate the IPL’s annual carbon footprint (i.e. an inventory of the total greenhouse gas emissions – GHGs – that contribute to climate change, resulting from direct and indirect resource consumption through DLF IPL 2010’s annual operations).
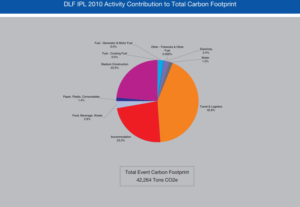
The total carbon footprint of DLF IPL 2010 was estimated to be 42,264 tons CO2e. DLF IPL 2010’s Carbon Footprint can be thought of as requiring 169,055 trees to ‘neutralise’ its impact on climate change over a period of 20 years. This equates to approximately 2,818 trees per match.
The following activities comprise its carbon Footprint, in order of decreasing magnitude: travel and logistics (18,073 tons CO2e – 42.8%), stadium construction (9,932 tons CO2e – 23.5%), luxury hotel accommodation (9,927 tons CO2e – 23.5%) , food, beverage, and waste (1,201 tons CO2e – 2.8%) and electricity (996 tons CO2e – 2.4%). These results are displayed in the chart below:
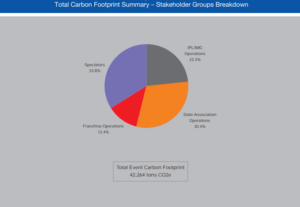
Relative stakeholder contributions to the DLF IPL 2010 Carbon Footprint are: IPL/IMG Operations (9,861 tons CO2e – 23%), state association operations (12,861 tons CO2e – 30%), franchise operations (5,243 tons CO2e – 12%), spectator activities (14,300 tons CO2e – 35%). The following chart displays the results:
A majority of the carbon footprint of DLF IPL 2010 is the consequence of activities related to its contractors, while only 23% of the footprint is a direct consequence of direct IPL/IMG managed operations. It is imperative that footprint mitigation strategies account for this aspect of footprint distribution.
Spectators are the most significant stakeholders in terms of contribution to total carbon footprint. Private vehicular travel is the single largest contributing factor – responsible for 6,517 tons CO2e (45%) of the stadium spectator carbon footprint. It is imperative to address this disproportionately heavy reliance on private transport consumed for spectator travel when addressing the overall IPL carbon footprint.
TV viewership-related carbon footprint for DLF IPL 2010 was 358,039 tons CO2e and far outweighed the contributions of any other stakeholder or activity considered within the IPL carbon footprint boundary. This component of carbon footprint, and its root cause–large quantity of consumption of electricity through TV sets–needs to be addressed with greater emphasis on its analysis and mitigation through innovative strategies and interventions in future editions of the IPL.
The impact of stadium construction, one of the primary activities contributing significantly to the IPL footprint, needs to be mitigated by intervening and exploiting opportunities to infuse low-carbon and green architecture and construction practices as the cornerstone of future stadium construction activities at proposed stadiums that are intended for use by the IPL.
Best practice examples for a majority of stakeholder functions within the IPL have been identified and quantified and their initial feasibility assessed. Best practice benchmark replication across the IPL must be pursued as a potent and actionable strategy for optimizing the carbon footprint of the IPL prior to any resource and capital-intensive carbon footprint minimisation strategies.
All interventions must be accompanied by effective communication to all internal and external stakeholders. They must also be in consonance with a well thought-out greening strategy that aims not just at a carbon neutral IPL but sets itself the loftier target of an IPL that is a net carbon sink (an indicative road map is presented in Appendix H of the original report).
Best practice incentivisation through formal programs and its incorporation into contractual negotiations processes with all vendors, contractors and other relevant stakeholders is ascertained to be the most feasible ‘first step’ on the pathway to drastically reducing the carbon footprint of IPL in the forthcoming seasons. Central IPL support and nurturing of competitive franchise behavior through formal recognition of the ‘lowest carbon footprint’ or ‘greenest’ franchise is one illustrative example that may be expanded to envelop all aspects of IPL operations in future editions.
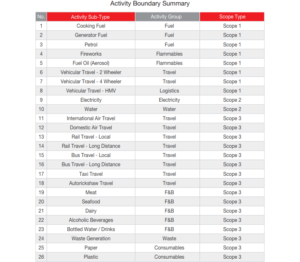
The carbon footprint determined as part of this project phase does not account for the entire life-cycle of the resources consumed and their comprehensive impact on Climate Change and ecology. Accounting for resource acquisition, processing, and disposal impacts could magnify the current extent manifold. A life-cycle analysis (LCA) of all primary resources consumed is essential to ascertain a more comprehensive carbon footprint that tends towards the true climate change impact of IPL. It is recommended that IPL 2011 be assessed on a LCA basis and that preparatory work for an LCA study be commissioned as part of the next phase of the project. The activity boundaries are outlined in the following table:
It is recommended that the IPL commission ECE to commence a comprehensive carbon footprint minimization analysis as part of a long-term ‘greening program’ (in fulfillment of its MOU with the UNEP’s Sports and Environment Unit) to identify means and alternatives for optimising and minimising its resource intensiveness.
Prior to minimising and offsetting the impact of future IPLs, it is recommended that the IPL commit to neutralise the impact of, as minimum, the four knock-out phase matches of DLF IPL 2010 (estimated to be 3,148 tons). While multiple options for offsetting are available in the conventional Carbon Offset market, the alternatives that result in equitable distribution of benefits to the grassroots stakeholder communities who are imperative to the project’s implementation are preferred as a more potent agent of social and environmental transformation.
The Orange County Foundation is a group of individuals who have experience in eco-friendly architecture and civil construction, and focus on sustainable urban development. The foundation has developed a self-sufficient green housing project at Pashan, Pune–the first of its kind–and is developing another green housing project, ‘Royal Orange County’ (ROC), at Rahatani Pune. This project involves eight multi-storied buildings, consisting a total of 353 residential flats. The ROC has adopted a number of sustainable and environment-friendly options, such as eco friendly architectural design buildings, renewable energy, waste management, wastewater management and low-carbon embodied construction and building materials.
Project Objectives:
Internal capacity building and skill development for the Orange County Foundation team to calculate the carbon footprint of their construction projects
License of authenticated database for India specific emission factors related to construction and building materials, electricity & energy, mobility, AFLOU, waste, and wastewater to map the environmental performance and sustainability impact of the Orange County Foundation’s projects
Life-cycle process mapping of the ROC construction to develop a toolkit for carbon ERP integration into their system
Carbon Footprinting of the design and construction phase of the ROC project
cBalance’s Roles:
Annual Enterprise-Use License for cBalance Carbon Emission Factor Database (CEFD) – cBalance authorized yearly subscription of the CEFD tool to the Orange County Foundation to map the carbon footprint of projects using India-specific emission factors of construction and building materials, energy, mobility, AFLOU, waste and wastewater.
Training to Orange County Foundation Team for Assessment of Carbon Footprint – cBalance team provided 16 hours extensive training to the Orange County Foundation team on the topic of carbon footprinting, life-cycle of a construction project and introduction to common carbon metrics for building operations. In addition, cBalance provided training on the CEFD tool and instructed how the CEFD can be helpful to choose sustainable and low-carbon activity or material alternatives.
Life-cycle Process Mapping and Toolkit Development for Carbon Footprint – The cBalance team visited the construction site and project office of the ROC. Through a site audit and interviews with project officers, cBalance mapped the activities related to the design and construction phase of the ROC. Thereafter, cBalance developed a toolkit that integrated into their existing system for mapping the life-cycle carbon footprint of the ROC and future projects.
Carbon Footprinting of Royal Orange County Residential Housing Project – The cBalance team collected data from the ROC on deforestation, electricity, fuels, and construction and building materials consumption of the construction phase of the ROC and calculated the construction phase carbon footprint using India-specific GHG emission factors. Finally, the cBalance team presented the carbon footprint analysis to the board of the Orange County Foundation.
Results:
Subscription to the CEFD and in-person training empowered Orange County Foundation team to:
calculate the carbon footprint of their projects using India-specific GHG emission factors
assess life-cycle environmental performance and sustainable impact of their projects
choose sustainable alternatives over conventional construction and building material
compare environmental performances of two different construction projects
create a baseline and frame future strategies to reduce the carbon footprint
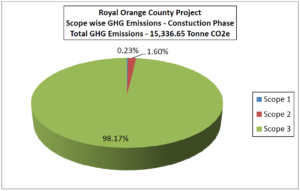
The Orange County Foundation team calculated the carbon footprint of the ROC construction phase and successfully achieved a 15% reduction in GHG emissions compared with previous projects.
The above graph demonstrates this 15% reduction. Below, the GHG emissions from the construction phase categorized by scope are displayed. As is obvious, almost all of the emissions were Scope 3.
This blog post summarizes the carbon footprint calculation conducted by Eliminate Carbon Emissions Pvt. Ltd to measure the greenhouse gas emissions of the Neemrana Fort Palace Hotel (pictured below).
Goals and Scope:
The project goals were to determine with the great degree of accuracy possible the total resource consumption inventory, total carbon footprint, and the activity-differentiated carbon footprint of the Neemrana Fort Palace Hotel’s operations. The activity boundaries were categorized as Scope 1, 2, and 3 emissions, with the results displayed in the following table.
The stakeholders were defined as the primary realizer (Neemrana Fort) and the fruit jam production facility (Nainital). While many activities resulted in direct emissions (Scope 1), some resulted in indirect emissions through the generation of electricity (Scope 2), and the emissions caused by the production of goods used (Scope 3) must be included as well in a GHG inventory. The emissions of the latter group were calculated using the life cycle assessment.
Results:
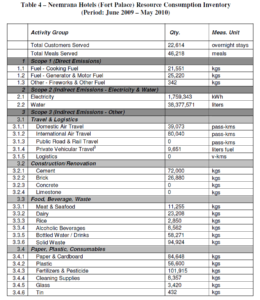
The following table presents the extrapolated aggregated resource consumption inventory for the Neemrana Fort Palace Hotel.
This resource consumption resulted in a total of 3,282 tons CO2e of 0.145 tons CO2e per stay from the period of June 2009 to May 2010. The results, categorized by activity, are displayed below.
As is obvious from the results, the vast majority of the greenhouse gas emissions came from the generation of electricity (83.5%). While nothing else came close, the GHG emissions from water (2.3%), generator usage (2.5%) and meat and seafood (2.6%) were also significant. Food, beverage, and waste as a category contributed 6.2% of the total emissions. The same results are displayed in the pie chart below.
Conclusion:
With electricity generation being responsible for so much of the hotel’s GHG emissions, efforts to reduce these emissions should focus on reducing electricity consumption. Staff and guests can work together to use less electricity through a number of voluntary (or mandatory) measures.
Schneider Electric Pvt. Ltd. commissioned cBalance to prepare a report showcasing the total carbon footprint of ‘Xperience Efficiency Yatra-2013,’ an event held across 44 cities that demonstrated how new energy technologies can change our lives and was attended by 11,792 customers and 3,422 Schneider Electric employees. The greenhouse gases (GHG) inventory was calculated using the sample data of 11 cities provided by Schneider Electric and generalizing for all 44 cities and accounted for the three major greenhouse gases: carbon dioxide (CO2), methane (CH4), and nitrous oxide (N2O). It was calculated according to the standards laid down in the GHG Protocol.
In the case of this report, the operational boundary for the GHG inventory was defined as:
Research Methodology
The research methodology consisted of the following steps:
Design questionnaire
Data collection
Data verification
GHG inventory calculations
Daya analysis
Reporting
Data
Data was obtained through a questionnaire designed by cBalance and collected by the Schneider Electric Marcom team at two levels: central and venue.
Central level data came from the back office of the Marcom team and included information such as hotel accommodations, communication materials, and air, rail, and bus travel of Schneider Electric employees, etc. It was available for all the 44 city events and the GHG emissions of these activities are, thus, calculated for all of them.
Venue level data was collected at the venues with the hotel staff as respondents. A universally applicable sample of 11 cities’ data was analyzed at the venue level.
cBalance used Footprint Reporter (FPR) to calculate GHG emissions, with the Footprint Report Emission Factor Database (EFDB) used as background data.
Electricity consumption:
Electricity consumption was calculated by using the number of hours the floor space of the venue was used for the event, with predefined electricity usage per square meter for 3 star, 4 star, and 5 star facilities being used for the analysis. It’s assumed that each session is 4.5 hours long (3 for assembly and 1.5 for disantling) and that events take place for 15 days in a month with an average of 8 hours per event.
Air travel:
Air travel activity data was calculated by estimating average passenger-km per flight (modeling that single flight by short, medium, and long haul type in FPR) and multiplying the footprint of each flight type by the total quantity of landings/take-offs (including stopovers), including circling-inefficiency (for domestic travel), per flight type. Short haul distances are defined to be between 0 to 694.5 km, Medium Haul distances defined as 995 to 1,620.5 km, and Long Haul distances are defined as 1,621 to 2,778 kms.
City travel and intercity travel of attendees:
The intercity travel of the attendees was considered to be 10% of the total attendees, with the other 90% traveling within the city. It was calculated for all modes of transport using the same data of city and intercity travel and was then estimated for the grand total attendees for all the events.
Accommodation:
Total overnight stay of employees of Schneider Electric in 3 star, 4 star, and 5 star facilities in different climatic zones (i.e. warm and humid, hot and dry, temperate) was computed and then modeled in FPR.
Food and Beverage:
It was assumed that every attendee consumed a liter of water at the event, and the emission per meal served was considered to be 0.855 kgCO2e.
Other activity data:
This included fuel consumption for diesel generator, heavy motor vehicles used in the logistics of the event, train and bus travel of Schneider Electric employees, and the total weight of recycled bags and brochures used.
Results
Scope 1, 2, 3 GHG Emissions:
As shown by the table and chart below, Scope 3 emissions were the largest contributor, at 57.8%, and Scope 1 emissions were the second largest, at 28.8%.
Scope 1 GHG emissions:
Heavy motorized vehicles used for event logistics were far and away the largest source of Scope 1 emissions, as is evident from the table and chart below.
Scope 2 emissions:
As demonstrated by the following table, all Scope 2 emissions are the consequence of electricity use. In terms of total magnitude, these emissions have a relatively low impact on the total GHG emissions as the events are not energy intensive and do not rely upon electrically powered machines or processes. These emissions consist of both- electricity purchased and AT&C losses.
Scope 3 emissions:
The table and chart below make it clear that accommodation was the largest source of Scope 3 emissions, followed by intercity travel.
Activity category-wise emissions:
Breaking down the emissions by activity gives us a different perspective from which to view the event’s carbon footprint. Accommodation was the single largest contributor to activity category-wise emissions, with 31.4 % of total GHG emissions, followed by logistics (24.0%). Intercity travel and purchased electricity consumption were also significant, at 15.7% and 13.4%, respectively. The rest were rather minor contributors.
Conclusion
This illustrates the total Carbon Footprint Summary of all the 44 city events as well as an average representing that for each city event. Total GHG emissions for all 44 city events amount to 388.384 Tonnes of CO2e, while GHG emissions per city event are 8.827 Tonnes of CO2e.