Recent posts filed under 'Projects'

A pathway for sustainable textile production : The Banswara ‘Higg’ experience

Do you recall the excitement when a piece of clothing caught your eye while walking past a shop or surfing the internet? Your heart yearning to purchase it amidst a sea of online advertisements or busy lanes filled with the glitz and energy of vibrant garment sellers. No matter who we are or where we come from, we might all be able to relate to experiencing an emotional reaction to some or the other piece of clothing we were drawn to buy, either for ourselves or a loved one, at some point in our lives.

The textile and apparel sector is worth US $2.5 trillion worldwide and plays a significant role in a nation’s economy, employment generation and exports. The ministry of textiles annual report 2021-22 states India is the world’s 6th largest exporter of textiles. The Indian textile industry has a large unmatched raw material base and manufacturing strength across the value chain. The share of textile and apparel, including handicrafts, in India’s total exports stood at a significant 11.4% in 2020-21. It employs millions of people, which includes a large number of women from the rural population. For a textile industry manager, these statistics may look promising and can fuel the motivation to invest in expanding and propelling this economic growth. While clothing is a basic human need, it is more often than not a tool to feed capitalistic greed. A greed that feeds on socio-ecological injustice propagated by unmindful production and consumption practices. What are the injustices that are being alluded to? And what can be done to address them?

The injustices of the textile industry and a pathway to responsible production 

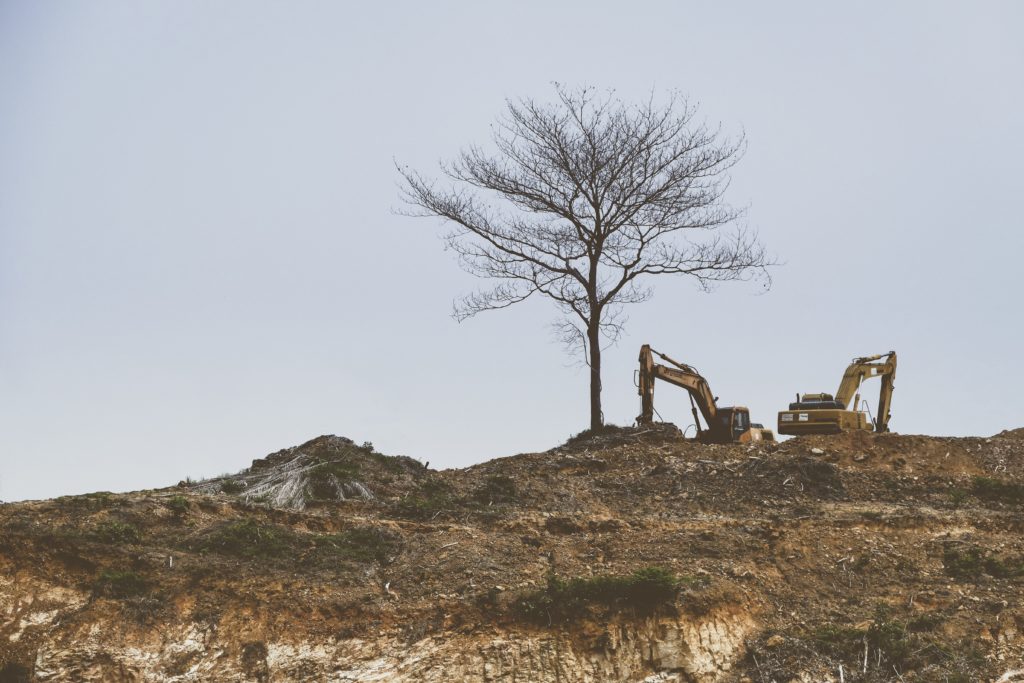
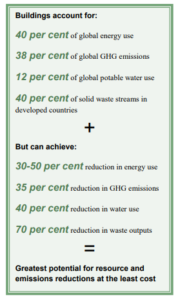
While the textile and apparel industry might make economic sense, the ecological and social impact of the industry warrants scrutiny, given the industry’s multifaceted impact. During its life cycle, an apparel necessitates extracting, using, and disposing of resources which release toxic components into the environment. Marginalised sections of society are most vulnerable to the consequences of such insensitive apparel production practices. For instance, in Maharashtra, textile finishing colour tints the Ulhas and Waldhuni rivers blue. Another heartbreaking example is that of the Bandi River, affected by textile dye pollution, which flows through the Pali district in Rajasthan. River water testing revealed that chemicals from the Bandi had contaminated wells and hampered farming operations within a three-kilometre radius. These atrocities are evident in other countries too. A prominent example is that of the Kantamanto market in Ghana, which acts as a dumping ground for used clothing of the global north, disrupting the local textile industry and polluting the coastlines with unusable waste clothing. Incessant and mindless mass apparel production activities can therefore exacerbate the contamination of life-sustaining ecosystems, human rights abuses, and climatic disasters. 

Growing public awareness and social cognisance about the environment are compelling the textile industry to produce environmentally friendly products. Consequently, many businesses and organisations are now focusing on environmentally responsible production methods. The Sustainable Apparel Coalition (SAC) is one such global, multi-stakeholder non-profit alliance aimed at supporting producers’ consumers and other stakeholders to move towards sustainability. It comprises over 250 prominent clothing, footwear, textile businesses, retailers, suppliers, service providers, trade associations, non-profits, NGOs, and academic institutions aiming to decrease environmental impact and promote social justice throughout the global value chain. The SAC created the ‘Higg Index’, a set of tools that standardise value chain sustainability assessments for all industry players. 

Higg Index : An overview 

The Higg Index helps stakeholders such as retailers, consumer goods brands, manufacturers, NGOs, governments and consumers to identify pathways to improve their existing practices and transition towards sustainable choices at an individual and collective level. It comprises a core set of five tools that together assess the value chain’s social and environmental performance and the product’s environmental impacts. These tools assess the environmental and social labour implications across the value chain. With this data, the sector can identify hotspots, continually improve sustainability performance, and achieve public demand for environmental and social transparency. The methodologies of the Higg Index have been developed over a decade in collaboration with SAC members, consultants, stakeholders, and industry experts.

The Higg tools include :

  1. Higg Facility Environmental Module (FEM), 
  2. Higg Facility Social & Labor Module (FSLM), 
  3. Higg Brand & Retail Module (BRM), 
  4. Higg Materials Sustainability Index (MSI), and 
  5. Higg Product Module (PM)

The following sections elaborate on the Higg Index evaluation process for Banswara Syntex. Banswara Syntex is a vertically integrated textile mill that produces high-quality yarn, fabric and garments. The organisation embarked on the sustainable production journey with the motivation to achieve science-based targets (SBTs) for textile industries. The targets are aimed at achieving absolute reductions of climate pollution and environmental harm, irrespective of economic growth (in terms of revenue or quantity of product produced annually). cBalance supported Banswara Syntex Ltd in using the Higg Index tool as part of this effort. The Higg Facility Environmental Module was considered best suited to support Banswara Syntex’s journey towards sustainability. 

The Higg Facility Environmental Module 

The Higg Facility Environment (FEM) module gives a comprehensive view of a facility’s sustainability performance. It facilitates assessing water use, waste management, and chemical management, among other relevant sustainability parameters. It has robust, standardised assessment parameters, which gives it an edge over the Life cycle assessment (LCA) tool. In addition, FEM provides a much broader scope of assessment as compared to carbon footprinting which is limited only to studying GHG emissions. Overall, it helps all industry players standardise value chain sustainability measures. The obtained data aids in finding hotspots for improving sustainability performance. It informs manufacturers, brands, and retailers about the environmental performance of their individual facilities, empowering them to scale sustainability improvements besides offering a clear picture of a facility’s environmental consequences. It assists in identifying and prioritising prospects for performance enhancement. 

For the Banswara project, the Higg FEM assessed the following parameters:

  1. Site information and permits
  2. Environmental Management Systems
  3. Energy Use and Greenhouse Gas Emissions
  4. Water Use
  5. Wastewater
  6. Emissions to Air (If Applicable)
  7. Waste Management
  8. Chemical Management

Except for the site-information and permits parameters, each parameter has questions structured in a three-level format (Levels 1, 2, and 3) that represent general thresholds of good, better, and best environmental practises.

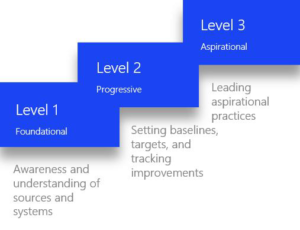
As part of this study, responses are analysed, and a score is allocated for each parameter according to levels. Based on this, total points are calculated by adding scores of all three levels for each parameter.

The Banswara Syntex Higg Experience 

Recommendations for enhanced environmental responsibility were suggested by cBalance based on Banswaras’ Higg Scores for different subsections of the Higg FEM. Besides this, impact reduction recommendations beyond Higg parameters and other relevant socio-ecological impact reduction mechanisms were suggested to ensure accountability for environmental impacts emerging from the textile plants’ activities. While all parameters of the FEM are relevant, this article focuses on only the ‘Energy’ parameter of the Banswara Higg exercise in the interest of providing a basic understanding of the Higg assessment at a glance. 

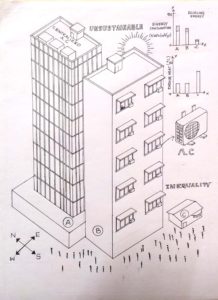
Banswara scored 80/100 for its energy-related practices. An indication of the facility’s progress at implementing a successful energy program. While good energy management provides significant benefits, including cost savings and efficiency, it requires adequate organisational focus and resources to correctly implement and be successful while reducing the impact on the environment. cBalance’s recommendations to Banswara based on its energy score are indicated in the image below : 

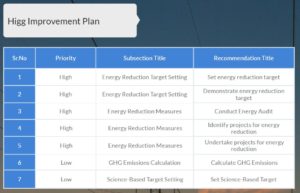
Recommendations for other parameters, such as water, wastewater, etc. were shared as relevant based on the Higgs assessment. A detailed report which elaborates on all parameters and recommendations can be found here. 

Way Forward 

The textile industry is deeply intertwined with our lives, and the injustices it propels compel us to address the consequences of profit-driven human production practices that have altered the earth’s ecosystems to the point that our survival appears to be in jeopardy due to changes that are becoming increasingly onerous to reverse every day. Coalitions like SAC bring much-needed hope and motivation for mindful textile production. It provokes questions of ecological and social balance and encourages textile industries to reimagine and adopt sustainable production practices. 

Healthy and responsible textile production calls for – consumers who purchase wisely and hold corporations accountable for unjust production practices, responsible textile-producing entities who look beyond profit and governments who overthrow unhealthy development agendas and move towards supporting and encouraging production and consumption practices that truly serve the planet’s needs. 

As Wendell Berry, a writer, farmer and environmental activist, reminds us,

But we can do nothing for the human future that we will not do for the human present. For the amelioration of the future condition of our kind, we must look, not to the wealth or the genius of the coming generations, but to the quality of the disciplines and attitudes that we are preparing now for their use.

It is, therefore, only through a collaborative effort of mindful living that we can safeguard our planet’s present and future and manifest a just and habitable world for all.

References

  1. https://globaledge.msu.edu/industries/apparel-and-textiles/background
  2. https://www.britannica.com/topic/textile
  3. Political Components of the Industrial Revolution: Parliament and the English Cotton Textile Industry, 1660-1774, Patrick O’Brien, Trevor Griffiths and Philip Hunt
  4. https://www.greenofchange.com/textile-pollution
  5. Toprak T, Anis P. Textile industry’s environmental effects and approaching cleaner production and sustainability, an overview. 
  6. The Environmental Disaster that is Fuelled by Used Clothes and Fast Fashion | Foreign Correspondent
  7. How 7.5 Million Pounds Of Donated Clothes End Up At A Market In Ghana Every Week | World Wide Waste
  8. The Higg Index – Sustainable Apparel Coalition
  9. https://theworld.org/stories/2021-10-18/how-west-s-obsession-fast-fashion-compounds-environmental-nightmare-ghana
  10. https://globalgreen.news/ghana-toxic-fumes-from-old-clothes-pollute-the-air/
  11. http://texmin.nic.in/sites/default/files/AR_Ministry_of_Textiles_%202021-22_Eng.pdf
  12. https://www.hindustantimes.com/mumbai-news/textile-finishing-dye-turns-ulhas-river-water-turquoise/story-vPDfGlKIAQGNS0g5yRAHUO.html
  13. https://www.fabricoftheworld.com/post/noyyal-and-bandi-rivers-shocking-cases-of-the-textile-industry-s-pollution-in-india
  14. https://sdgs.un.org/goals/goal12
  15. https://ajssr.springeropen.com/articles/10.1186/s41180-020-0032-8#Tab4

Author : Vipul Patil

Editor : Vinita Rodrigues


From Airtravel to Fairtravel

Why & How Individuals and Organisations, Should & Can Rethink Travel Choices for a Sustainable World.

Photograph: Ante Hamersmit on Unsplash

“Heal the world

Make it a better place 

For you and for me and the entire human race, 

There are people dying 

If you care enough for the living, 

Make it a better place for you and for me”

Michael Jackson’s ‘Heal the World’ is a reminder for us that as humans we have the ability and opportunity to heal just as often as we cause socio-ecological wounds knowingly or unknowingly.Something to remember while reading this article and considering your organisational and/or individual approach to travel.

Our transport systems and socio-ecological injustice

Our transport systems play a major role in shaping the overall condition of the planet we inhabit : Coasts are being reclaimed to make way for coastal roads directly jeopardizing the lives of marine organisms and fisher folk. Other life supporting ecosystems such as mangroves are being choked to make space for airports and its accompanying infrastructure.  Forests and farmlands are being destroyed for high-speed intercity travel. In the everyday world the comfort of smoke-emitting vehicles is prioritized over cyclists, pedestrians and other living beings, too. Vehicles and the infrastructure they necessitate, no matter where they are based, contribute to carbon pollution and impact the lives of the vulnerable, the most! How do we know who is vulnerable? Well, they are the people and living beings whose voices you’ll barely hear on the news and won’t hear directly on social media sites at all. These are the voices smothered by concerns over GDP and social status. Reflect on this a bit and you’ll know who we are talking about. 

Photograph: qinghill on Unsplash

Transportation is therefore one of the many factors contributing to carbon pollution and the climate crisis it catalyzes. For instance, people and other beings have to battle floods, droughts and climate crisis induced calamities. There have also been reports of people losing lives due to health ailments propagated by pollution, too. You might be wondering what you can do about this.  This article shares a humongously impactful but not yet widely popularised way to contribute to a sustainable and just world- by rethinking our priorities and our travel choices.  

We are here to convey the need to minimize and as far as possible replace  a seemingly  clean and convenient, yet monstrous and deeply unjust mode of travel – air travel. To let you know that this vital yet seemingly impossible proposition is in fact a possibility, we’ll also share our experience of working towards this within our own organisation and with WIPRO Ltd. (IT company) .

Why reconsider air travel?

The airline industry cleans up its appearance pretty well but only after smothering life giving ecosystems and causing much carbon pollution. Beginning at the airplane and airport construction and continuing with fuel extraction and other processes, air travel is far from clean. Additionally, the seemingly ‘clean’ interiors of airplanes and airports, are breeding grounds for social inequity. They constantly endanger the health of both social and ecological systems. To support this here is some data compiled by our collaborating network to counter aviation, StayGrounded.

Air travel  is accessible unequally across the globe :

This mode of travel that is accessible to only the privileged few is in fact one of the largest climate crisis perpetrators :

One of the many reasons the total climate impact of aviation is not recognised is because of a lack of focus on the non-carbon dioxide emissions by the sector :

You might wonder, ‘Why not transition to e-fuels and other existing alternatives?’ However, while climate mitigating alternatives like biodiesel and solar powered or electric aircrafts might seem promising, they are for the time being at least ‘deficient’. Solar PVs have a negligible impact, biodiesel availability is insufficient to meet the present let alone future demand (not to mention its own climate impacts) and the expected timeline for electric aircraft in regular commercial operations is not earlier than the end of the 2030s. For details of these critiques refer to the ‘Airline industry’s response’ section of this article. So if the choice of fuel or power source for air travel is not enough, what will get us closer to a sustainable travel? 

Beginning to step away from air travel: The cBalance and Wipro experience

The first step to reducing air travel is to re-think about the criteria we use to evaluate it. You may think it is a more hygienic, fast and comfortable means of transport. You may also see its necessity for in-person business meetings. Why would we sacrifice such a convenient, comfortable and efficient mode of travel? This is where considering the sociological and ecological injustices and looking at the present day realities of our time, inclusive of the covid-19 pandemic and other natural and human-induced disasters, has changed the stakes. If sacrificing comfort is our concern, can we sacrifice the lives of our fellow humans and other non living beings just for comfort? If hygiene is our concern, can we ignore the dumping of toxic GHG gases in the air, impacting the health of the present and future generations of humans and other beings? If travel time is our concern, do we really need to travel that much? (Hasn’t the covid- 19 situation revealed that virtual meetings get much of the job done.) Or can we make the time spent travelling something that adds to our lives, something that we can be present to, if not look forward to? 

Since 2015 we have been supporting Wipro Ltd. in studying their organisation’s flying patterns and suggesting ways to reduce carbon pollution from air travel. Wipro has managed a 15-20% reduction of climate impact from air travel, between 2015 and 2020. This reduction has been gradual and has involved them integrating the following suggestions in their organisations travel policies:

  1. Choosing non-stop flights over multi-stop flights, as far as possible.
  2. Choosing virtual meetings over in-person ones whenever possible.
  3. Choosing airlines having less carbon footprint (Best-in-class airlines)
  4. Choosing economy class over business class travel
  5. Transitioning to bus/train travel, as far as possible.
Photograph: Paul on Unsplash

As is evident from these measures, Wipro attempts not only to reduce the impact of their flying but also to reduce flying itself. This is based on the knowledge that over a 1,000 km journey, an air traveler emits 285 kgs of CO2 kilometer while a railway passenger in even an AC executive-class compartment emits 30 kgs while in a comfortable AC bus the same passenger emits 70 kgs (Ref 1). Wipros policy includes that journeys in India that are less than 12 hours long need to be by train, unless employees are supposed to be back in the office on the next day. At cBalance we ourselves take this measure a step further. Everyone from the most-experienced to the youngest team member travels by rail for domestic travel irrespective of the number of hours of travel. However, this policy is not implemented without consideration. If someone is unwell or unable to sit for long hours or if there is an emergency and air travel is unavoidable we do consider it. Such a progressive policy may take some work to be implemented in organisations such that it is applied appropriately. It may require challenging conversations around what is a ‘need’ and what is a ‘want’. It may require challenging conversations around positions of power and economics. However, it is precisely because of the disproportionate impact and injustice that those with privilege have caused and continue to cause that this is the direction in which we must move and that the privileged must make the start. For example, it will be of little use if policies such as Wipro’s are not applicable to employees across all grades. Fortunately, Wipro is in the process of addressing such loopholes. 

Similarly, while smaller organisations like ours have long chosen virtual meetings with overseas partners and other sustainable choices, events in recent years are necessitating that even larger companies reconsider their choice to fly. The Stay Grounded network presently comprises 160 members across the globe who are doing the same. And there are of course organisations beyond the network acting in the same direction to minimize socio-ecological injustices of the air travel industry. There are even some governments making efforts to minimize air travel too.

Moving into ‘Fair Travel’  

‘An average medium-haul domestic return flight from Bangalore to  Mumbai emits climate pollution (i.e. greenhouse gasses) that neutralizes the benefit of 100 trees – essentially, cut down forever. This can be seen as personally chopping down 1 tree at the end of the return flight, each time we fly’ (ref 2)

Since travel is a major component of IT and Finance/BPO service companies, the Fair Travel program is focused on working with pioneering IT and BPO/finance companies in India through a participatory method called ‘Carbon Reduction Action Groups’ (CRAGs). When successfully employed in global enterprises CRAGs will enable a mixed group of employees to set their own carbon footprint reduction targets, including climate impacts from business-related air travel. These groups will then be able to work toward co-creating their roadmap to achieve these reduction targets. As with Wipro, cBalance’s FairTravel program will provide the necessary training and support to achieve these. FairTravel will also provide carbon footprinting and other decision support, along with communications support for Corporate Sustainability teams to amplify these pioneering efforts. For more details on this program please visit this link

For many of us, some of our fondest memories include travelling and some of our greatest achievements include working together to address challenges. Fair Travel is an opportunity to ensure that our collective journey is made up of responsible choices and that we continue to have fond travel memories and satisfying work. We need to begin now. Let’s heal the world and make it a better place for you and for me and the entire human (and non-human) race!

References:

  1. Based on independently verified India-specific emissions factors developed by cBalance and audited by Western State Colorado University (WSCU)
  2. http://cbalance.in/wp-content/uploads/2017/05/CB_Wipro_AviationEF_CaseStudy_v5.pdf

Editors: Neesha Noronha, Namratha Sastry, Vivek Gilani

Life Cycle Assessment: How Suppliers Can Meet Conscious Consumer Demands

Only what is “Good for the Planet” is “Good for me”: The Conscious Consumer

“I experienced dry skin because of chemicals in my dishwashing soap. The discomfort made me switch to soapnut”, a friend explained as I was researching what made consumers choose consciously made products. My friend is part of a growing tribe of people who take health/sustainability/social justice matters into their hands and resort to making their own house cleaning, body care, food products, etc., themselves. Such endeavours have occasionally grown to provide these products at a small scale, either locally or to niche mostly urban groups, for example through farmers markets or through boutique and pop up stores both online and offline. They are the modern avatar of the home or cottage industry with the supply chain and financial accoutrements of the formal sector and the marketing savvy of the digital age. The credibility of the manufacturer (often self referenced as ‘artisan’) is typically established through direct contact/relationship or word of mouth and maintained through having simple products with limits to scale in terms of production and sales capacity and a highly responsive feedback loop.  Because such enterprises usually involve intense efforts and levels of commitment that are not aligned with the global scale and fast pace of many, although growing in popularity, they are far from the norm.

On the other end of the spectrum are products whose standards we take for granted. Often these are mandated by law or industry norms and concern quality and manufacturing processes including conditions under which it is handled and supplied and the absence of known “contaminants”. Producers or suppliers may additionally bolster product sales with claims of convenience, accessibility and cost and with alluding to “desirability” or “goodness”. But who defines and who measures these? And where do these criteria fit with the emerging demands of the conscious consumer for “good for me, good for people, good for planet”? 

While the individual consumer’s search for responsible products may have been initiated by any variety of personal concerns and motivations (often expressed as interrelated) there is also a groundswell in the same direction by civil society organisations and media. Where information on companies violating human rights and environmental laws may have once been the sole concern of activists or NGOs, their relevance to common people and their consumption habits is being recognised and highlighted. Rather than follow from individual motivations these are guided by a motivation best expressed by Wendell Berry in Native Hill, “We have lived by the assumption that what was good for us would be good for the world…  We have been wrong. We must change our lives, so that it will be possible to live by the contrary assumption that what is good for the world will be good for us. And that requires that we make the effort to know the world and to learn what is good for it. We must learn to cooperate in its processes, and to yield to its limits.”  Consumers, at an individual level, have begun to eschew brands that do not meet perceived ethical norms (with celebrities and influencers ceasing to endorse them). At a collective level they have begun to participate in movements such as climate strikes, in person and through digital campaigns which push governments and suppliers to be responsible for the sourcing, manufacturing, use and disposal of products. They push for the creation of new standards and new ways to hold producers accountable.

It is in this larger arena that national and international supplier platforms, online brands as well as those with physical stores, can perform a democratising function by scaling up the establishment of a new ethic for business. They bring desirable but optional standards closer to being non negotiable starting grounds. It is often the supplier platform which is the keeper of the consumers trust, from whom transparency and accountability is demanded and which stands to lose credibility when ethical norms are breached. This is beyond the traditional logistical role of connecting demand to supply. The platform can prove its integrity by investing in processes of product and producer verification. Often for small scale producers who may not have the financial capacity to undergo expensive quality testing and certification it is the supplier platform that can provide this “service”. On the other side this service breaks down the complexity of the modern product and production process and gives consumers the necessary information to make informed choices between these products/producers based on various criteria.

Life Cycle Assessment: Building Supplier and Producer Responsibility

The Better India (TBI) is an online social impact platform. One of its initiatives is its one-stop-shop that connects consumers with eco-sensitive and socially just products. Since the majority of today’s production processes involve multiple stages across diverse locations with numerous exchanges between “hands” involved, suppliers like The Better India who do not source nor sell their products locally and perhaps even the producers themselves who make these products but do not source their raw material locally may easily be unaware of all the impacts of their products. However, in an age of information technology, this is no longer a good excuse and it is precisely the effort to verify the products and producers that engender trust in suppliers and brands like TBI. TBI  approached us at cBalance to help them identify house cleaning products by small scale producers that are made from “natural” and “eco-friendly” ingredients, “non-toxic” and “safe” for both users and the planet. They were keen to educate themselves and break down the elements that make up these commonly used terms.  They also wanted to ensure a process that would allow them to impartially assess and choose the best options as well as to support production needs for producers who do not have the means to address these standards. The products ranged from floor cleaners to laundry detergents and from toilet cleaners to dishwashing detergents and multipurpose cleaners.

We supported TBI by conducting a life cycle assessment (LCA) of each product. ‘The term “life cycle” refers to the major activities in the course of the product’s life-span from its manufacture, use, and maintenance, to its final disposal. It is a “cradle-to-grave” approach which encompasses all activities right from the gathering of raw materials from the earth to create the product and ends at the point when all materials are returned to the earth’[i]. The process involves compiling a list of relevant material and energy inputs besides environmental emissions during a products life cycle and assessing the environmental impacts associated with these inputs and emissions. Life cycle assessment stages are illustrated in the diagram below (image 1).

Image 1: LCA stages (source: http://people.cs.uchicago.edu/~ftchong/290N W10/EPAonLCA2006.pdf)

For TBI’s purposes we also added non-ecological impact categories including social impact (contribution to local livelihoods), ethical sourcing (source of raw material), product effectiveness (eg. grease removal efficiency, stain removal efficiency, etc), product pricing and supply scale potential as part of the overall assessment. The categories would be combined into a ‘Household Cleaner Supplier Scorecard’ which would aid the TBI team in objectively and thoughtfully narrowing down on suppliers.

In order to be able to make appropriate assessments and comparisons cBalance  developed appropriate data collection methods including supplier questionnaires, disclosure sheets, site visits and procuring product samples ( for external lab tests) . We also conducted research on the hazardous impacts of product components on human and ecosystem health. All product information was analysed using a uniquely developed ‘Excel- based LCA tool’. These LCA calculations were later combined with calculations of non-ecological aspects to develop the ‘Household cleaner supplier scorecard’ for product comparison.

—————————————————————————————————————-

Project details , processes and outputs can be found here: https://cbalance.in/wp-content/uploads/2020/11/CB_TBI_LCA_Housecleaners_v0.3.pdf

—————————————————————————————————————-

The scorecard revealed that while few supplier products had negligible ecological impact, a few of them had an unexpectedly high ecological impact. This enabled the TBI team to recognise a dearth of knowledge on negative impacts of product components among some suppliers. They recognised the need for capacity building of producers through providing handholding support to overcome product shortcomings. Additionally, TBI also worked towards ensuring reusable and refillable product packaging; an endeavour that demands consumer responsibility to return bottles for recycling and purchase refill packages to minimize life-cycle impact.

Way forward: Creating common ground

Amidst fears of “greenwashing” it is the shift in perspective away from blaming and shaming that is highlighting the way forward for consumers, producers and the market in general. TBI used the LCA not only to evaluate products and choose between suppliers  but also to identify areas for improvement for itself and producers. As other producers and suppliers similarly pick up and assume responsibilities as TBI did, they are offering essential elements of trust that have long been missed in the exploitative global economy.

Another shift is in creative collaborations and making way for new language and shared standards of what is acceptable or not in production processes, and for engaging in transparent and verifiable practices. Typically LCA softwares are expensive, but an excel based LCA tool such as cBalance developed makes such efforts more affordable. For TBI it served not just as an evaluation tool but as a product enhancement tool, indicating aspects that need to be altered to minimize negative impact. In a different collaboration, such as with the Ministry of Micro, Small and Medium Enterprises it holds the potential to enable many more suppliers and even producers to be part of creating and upholding standards. The LCA tool can also be used to facilitate conversation among stakeholders, the results when presented in varying forms can serve different functions including to educate consumers. Indeed, even when the tools themselves are not necessary, such as in the contexts that we began this article with, the clarity that such frameworks bring to the table can spur many more creative possibilities. Given the times we are living in, the interconnectedness of our market systems and the social and ecological systems they depend on cannot be denied. Ensuring responsible products is therefore a responsibility that can only get lighter, easier, cheaper with more people to shoulder it.

Reference:(i) Scientific Applications International Corporation (SAIC), & Curran, M. A. (2006). Life-cycle assessment: principles and practice. http://people.cs.uchicago.edu/~ftchong/290N-W10/EPAonLCA2006.pdf

Co-author: Neesha Noronha, Editor: Vivek Gilani

The Building Economy and Carbon Footprinting: Stepping Forward to Protect our Common Home.

What is ‘enough’ in construction and even in life in general? What are we looking at in terms of impact when we construct a massive glass building in the middle of tropical cities like Pune or Mumbai or Bangalore? Are we just constructing something that gives us a panoramic view of the city and serves no other function? Isn’t this similar to spending crores on making an oven and then spending crores more to refrigerate it?” 

These are the questions Mr. Nilesh Vohra, a young builder of Kanchan Developers, Pune was asking himself after a conference on ‘Defaulting Green’ in Kerala a few years ago. Nilesh is part of the Green Buildings Committee of the Pune chapter of a nationally recognised builders association in India and met inspiring green building consultants and developers through this forum. These are his initial manoeuvres into responsible construction practices. 

Nileshs’ questions draw attention to the need for constructing buildings that are not solely driven by social notions of a ‘premium’ building (in this case, glass buildings), but also consider the social, economic and environmental implications of designing such buildings, which when not considered are detrimental to society and the environment as a whole.

Why should the building economy consider moving towards green building construction, immediately? [footnote-(fn1)] In an era of human-induced climate crisis (fn2), we need to limit global warming to less than 1.5°C above pre-industrial levels, since estimates state that an increase in temperatures beyond 1.5°C will accelerate the climate crisis, resulting in increased unpredictable and uncontrollable occurrence of disasters such as floods, droughts, biodiversity loss, cyclones, etc. These episodes impact vulnerable sections of society in-equitably; not only are those from economically poorer backgrounds impacted first, but women, children, the elderly and sick are also vulnerable. Everyone, irrespective of who we are, will bear the consequences of climate  collapse. The damage to buildings and other property, goes without saying, too. In order to avoid such damage, climate scientists caution towards reducing our greenhouse gas (GHG) emissions by 45% before 2030 and reaching net-zero emissions by 2075. The role of the building economy in contributing to GHG emissions and its potential to mitigate it are stated in the image (UNEP, 2012).

If constructing a ‘safe’ building is a non-negotiable value , considering the implications of the building economy on the environment, can green buildings be an option or are they a necessity?

According to India Brand Equity Foundation (2018), the number of Indians living in urban areas will increase from 434 million in 2015 to about 600 million by 2031, increasing the demand for residential and commercial buildings, both. Recognising the projected increase in construction activities, there seems to be ample opportunity to move towards responsible green building construction. Easy to say “Construct green buildings.” but how do we go about constructing these? What are the steps we have to take to implement these ideas in reality? How do we encourage and support the likes of Nilesh Vohra in making these a priority, amidst all the other logistical and bureaucratic challenges of building in these times? Based on our experience with carbon footprinting and ongoing dialogue with stakeholders contributing towards building construction, we offer some perspective that can facilitate the move forward. 

Carbon Footprinting: A means towards responsible construction

What is carbon footprinting and how is it useful? Carbon footprinting is a measurable, verifiable and comparable instrument that entails measuring the carbon emissions during different operations and activities, in this case, building activities. This supports identifying alternatives to reduce emissions and where these would be most effective, thereby minimizing the negative impacts of construction on the environment. By quantifying carbon reduction efforts in building construction, meaningful and comparable information can be shared with building sector counterparts as well as potential buyers creating a base of evidence and commitment towards responsible construction. Carbon footprinting of building projects is a means for builders to begin demonstrating care for the larger world we belong to.

Just as one would not simply measure blood sugar levels of a diabetic without the intent to reduce them, responsible building, therefore, does not end with measuring the carbon footprint of a project. Incorporating actionable steps to mitigate emissions that are avoidable is the most important part. 

The cBalance Carbon Footprint Experience

We supported carbon footprinting of the Royal Orange County Residential Housing Project as well as for two townships of Lohegaon and Zandewadi in Pune, respectively. Besides this, internal capacity building and skill development for the Orange County Foundation team was conducted to equip them with skills for calculating the carbon footprint of their construction projects. [Links to detailed reports of the three projects mentioned, are given in a box below. An overview of learnings from engagement with carbon footprint projects is provided at the end of this section, too.]

In the case of Orange County, a comparison was made between their previous projects and the Royal Orange County (ROC) Residential Housing Project which incorporated low carbon efforts such as eco-friendly architectural design buildings, renewable energy, waste management, wastewater management and low-carbon embodied construction and building materials. The calculation of the carbon footprint of the construction phase by the Orange County team revealed 15% lower emissions for the ROC construction compared to their previous projects.  It should also be noted that Orange County incorporates sustainable principles in its construction projects by default and comparing the life cycle carbon footprint (fn3) of the ROC with other builder projects in Pune would probably demonstrate a much larger difference in emissions. 

In the case of Lohegaon and Zandewadi townships in Pune, Maharashtra, we were asked to conduct carbon footprinting at the request of VK:e environmental, an architecture consultant. The project builders were required to submit a carbon footprint projection report including measures they would undertake to mitigate emissions to the State Environment Committee (SEC), Maharashtra prior to the start of the project. At the time, there wasn’t a standardized protocol available for township carbon footprinting (currently a GHG Protocol for Cities is widely used), so CB used multiple protocols to ensure quality measurements. This was undertaken considering that multiple iterations of footprinting using different protocols would lead to similar conclusions which would strengthen belief in the mitigation recommendations that would be suggested.

Following were the findings after conducting life-cycle carbon footprints of the two townships:


   Township

                            Emissions  

 Mitigation Potential

Business As Usual (BAU) Low carbon scenario
Lohegaon 3.51 million ton CO2e  2.48 million ton CO2e 1.02 million ton CO2e
Zandewadi 3.15 million ton CO2e 2.24 million ton CO2e 0.90million ton CO2e


Recommendations were conveyed to enable the builders to incorporate low carbon measures during the building process. Few of the recommendations that were suggested include: 1. Using natural afforestation methods rather than conventionally used plantation-forestry methods to compensate for the carbon absorption capacity that would be lost due to irreversible damage caused to the land on which the construction would occur. This recommendation suggested planting native trees and using the Miyawaki method of afforestation. 2. Reducing energy consumption by integrating passive design techniques such as the use of thermal mass to reduce heat gain, insulating materials or cavity walls, appropriate shading strategies for fenestration, low-U glazing, low-E films, and heat-reflective paints. 3. Inclusion of structure and radiant cooling systems within all floor and ceiling slabs to mitigate solar heat gain through rooftops and walls. 4. Designing flats in a manner that enables integration of natural refrigerant-based split ACs should the flat owners choose to install an AC.

Illustrations of Passive cooling strategies.


In comparing the projects; Orange  County through implementation of low carbon measures actually demonstrated mitigation gains, whereas in the case of the two townships only the potential mitigation gains were revealed. Thus, while we participated in SEC hearings to encourage the SEC to approve the carbon footprint report and clear the township projects only if the builders take steps that align with the recommendations made, this was the extent of our influence. It still remains the purview of the SEC and other industry boards/ government authorities to compel builders to implement actionable steps towards reduction, compared to BAU construction.

Way forward

If the potential for environmental safeguarding during construction is no longer in question, then other factors must influence the decision to do so. What would make it accessible and worthwhile for builders to carry out these activities? According to Nilesh two critical obstacles for builders are the lack of investment in the sector and the lack of demand from end-users. For both, carbon footprinting presents itself as a step towards addressing these gaps. 

An open disclosure tool, similar to other online tools, requires users to merely submit relevant data, which is then automatically processed to display the final results. Such a tool would enable multiple builders to present their carbon footprint calculations which would essentially create a feedback loop that shows where buildings can undertake at least the well-known measures to control carbon emissions such as using local materials, ensuring energy reduction during the operations phase, conservation etc. A life cycle carbon footprint additionally shows not only the savings at the time of construction but also the potential future energy and emissions savings (during occupation). Last, but definitely not least, it also shows where sustainable solutions pay back over time even those that may initially cost more. With such data it is possible to show investors and government and regulatory bodies from the local municipal level right up to the national and international levels, that such benefits can and should be tied to decision making and evidence-based policy making that favours and rewards responsible construction. 

CBalance can create an affordable, sensitive and user-friendly tool and would invite industry associations such as the Confederation of Real Estate Developers’ Associations of India (CREDAI) to collaborate in this to encourage an increasing number of builders to voluntarily engage in carbon footprinting. This, along with recommendations based on the marginal abatement cost curve, can give builders a range of emissions mitigation opportunities from the least cost option to the highest cost. Additionally, our experience with building in-house capacity for carbon footprinting itself with the Orange County team showed that this too was not difficult. Thus, we recommend using a standard protocol for measurement and coupling in-house capacity building and engagement with consultants who are experienced in the field, to provide appropriate mitigation measures.  

At this stage, it is in the collective hands of the builders to push for responsible construction processes at a larger scale, benefitting both, the building economy and the planet as a whole. If they have the vision and will to do so, carbon footprinting and cost-efficient sustainable alternatives like passive design techniques can easily replace ecologically destructive and expensive practices like air-conditioned glass buildings. Builders like Orange County have found ways to translate the wide variety of benefits it holds for residents and the wider community. Ultimately, raising the level of demand for responsible construction from multiple quarters can make shared responsibility and accountability a grounding and enlivening force for the building economy rather than an unwanted burden to be passed off or signed off on at the first opportunity. It will take many more Orange Countys and many more young builders like Nilesh to tip the scales and make sustainable the default. Whether you’re a builder, business person, government official, concerned consumer or citizen, at this juncture in time with climate chaos knocking at the doors of each one, which way you choose to step or what you choose to put your weight behind may change the course of not just your life but the nation and the planet too.   

Report links:
https://cbalance.in/wp-content/uploads/2016/09/VKe_TownCF_Report_Lohegaon_v8.pdf
https://cbalance.in/wp-content/uploads/2016/09/VKe_TownCF_Report_Zendewadi_v6.pdf
https://cbalance.in/wp-content/uploads/2015/09/CB_Orange-County-Foundation_Case-Study_v0.4.pdf

Footnotes (fn)

(1) A green building incorporates design techniques, materials and technologies that minimize its overall impacts on the environment and human health. This is achieved by better siting, design, material selection, construction, maintenance, removal, and possible reuse. Main outcomes are minimum site disruption, reduced fossil fuel use, lower water consumption, and fewer pollutants used and released during construction, occupation and disposal of the building. (UNESCAP, 2012)

(2)With ecological emergencies occurring the world over cBalance is choosing to use language that urges immediate action by all of society to address our individual and collective roles in the trauma of climate change.(https://www.theguardian.com/environment/2019/oct/16/guardian-language-changes-climate-environment)

(3) The life cycle carbon footprint includes emissions from the anticipated occupation of the building as well as emissions during construction. 

References

https://www.uncclearn.org/sites/default/files/inventory/unep223.pdf

https://www.care.org/sites/default/files/documents/CC-2009-CARE_Human_Implications.pdf

https://www.theguardian.com/environment/2012/jan/16/greenhouse-gases-remain-air

https://ghgprotocol.org/blog/climate-change-and-cities-what-we-need-do

https://www.unescap.org/sites/default/files/3.%20Green-Buildings.pdf

https://s3.amazonaws.com/legacy.usgbc.org/usgbc/docs/Archive/General/Docs19073.pdf

https://www.uncclearn.org/sites/default/files/inventory/unep207.pdf

Telephonic conversation with Nilesh Vohra (Kanchan Developers); May 19, 2020.

Contributors:

Neesha Noronha, Vivek Gilani, Dhrumit Parikh

Illustrations:

Aliullah Shaikh

Wipro’s Air Travel Emissions

cBalance has been engaging with Wipro, an Indian Information Technology Services Corporation, to estimate their GHG emissions from air travel since 2015.
The objective of the project has been to estimate GHG emissions from air travel, analyze Wipro’s flying patterns, estimate possible reductions in GHG emissions and recommend strategies to reduce GHG emissions.

The analysis was adhered to GHG Protocol’s Corporate Standard, accompanied by IPCC Guidelines 2006 to calculate airline specific emission factors (insert footnote)

Following the equation:

GHG Emissions = Activity Data  x  Emission Factor

Here, the Activity Data was the distance between Airport A to Airport B, calculated using great circle equation.
Emission factor was given in terms of kg CO2e / pax-km for each airline, distinguished based on whether the flight was International or Domestic and whether the flight was short, medium or long haul (this was determined based on the distance).

View detailed methodology here.

FY 2014-2015 & FY 2015-2016

For FY 2014-2015 estimated GHG emissions were 170.1 thousand tonnes CO2e, with 1,269.8 million pax-km traveled across 5.0 lac flights
For FY 2015-2016 estimated GHG emissions were 152.9 thousand tonnes CO2e, with 1,134.4 million pax-km traveled across 4.7 lac flights

During these two cycle of analysis, other than estimating the GHG emissions from air travel, the major emphasis was on quantifying reduction potential and study reduction strategies. This was achieved by modeling two scenarios :
Best-In-Class Switch :
The goal of this scenario was to determine, for a given flight, the best airline in terms of emission factor ranking for its specified route. This helped us and Wipro quantify reduction potential just by switching over to a more efficient airline.
The estimated GHG emissions reduction from Best-In-Class switch for FY 2014-2015 were 59.9 thousand tonnes CO2e and for FY 2015-2016 were 36.9 thousand tonnes CO2e
Multi-stop to Non-stop Switch :
The goal of this scenario was to determine possible reductions in GHG emissions switching from a multi-stop flight to a non-stop flight.
The estimated GHG emissions reduction from Multi-stop to Non-stop switch for FY 2014-2015 were 19.4 thousand tonnes CO2e and for FY 2015-2016 were 11.7 thousand tonnes CO2e

In total, 79.3 thousand tonnes CO2e and 48.6 thousand tonnes CO2e reductions were estimated respectively for FY 2014-2015 and FY 2015-2016

View emission comparison report between FY 2014-2015 & FY 2015-2016 here.

A white paper titled Reducing Air Travel Emissions can be read here, where we have ranked airlines based on their GHG Emission Factor.

FY 2016-2017 & FY 2017-2018

For FY 2016-2017 estimated GHG emissions were 130.2 thousand tonnes CO2e, with 923.7 million pax-km traveled across 2.1 lac flights
For FY 2017-2018 estimated GHG emissions were 116.5 thousand tonnes CO2e, with 836.8 million pax-km traveled across 1.9 lac flights

Since the recommendations of flying the best-in-class airline, flying non-stop over multi-stop and choosing to travel via railways and/or use video calling services were already implemented, during these cycle only emission estimation was conducted on the business unit level.
For future development, the goal is to implement emissions and a financial budgeting system with respect to flying on a business unit level with the idea that it would create responsible air travel amongst employees.

Details on the Business Units wise emissions for FY 2016-2017 can be viewed here.

Furthermore, click here to view a comparison between Economy vs Business Class emissions between FY 2016-2017 and FY 2017-2018

IPL 2010 Season Carbon Footprint Control Project

Eliminate Carbon Emissions (ECE) Pvt. Ltd was contracted by the IPL Management upon the recommendation of the United Nations Environment Program (UNEP) to calculate the IPL’s annual carbon footprint (i.e. an inventory of the total greenhouse gas emissions – GHGs – that contribute to climate change, resulting from direct and indirect resource consumption through DLF IPL 2010’s annual operations).

The total carbon footprint of DLF IPL 2010 was estimated to be 42,264 tons CO2e. DLF IPL 2010’s Carbon Footprint can be thought of as requiring 169,055 trees to ‘neutralise’ its impact on climate change over a period of 20 years. This equates to approximately 2,818 trees per match.

The following activities comprise its carbon Footprint, in order of decreasing magnitude: travel and logistics (18,073 tons CO2e – 42.8%), stadium construction (9,932 tons CO2e – 23.5%), luxury hotel accommodation (9,927 tons CO2e – 23.5%) , food, beverage, and waste (1,201 tons CO2e – 2.8%) and electricity (996 tons CO2e – 2.4%). These results are displayed in the chart below:

IPL, Carbon Footprint, GHG emissions,

Relative stakeholder contributions to the DLF IPL 2010 Carbon Footprint are: IPL/IMG Operations (9,861 tons CO2e – 23%), state association operations (12,861 tons CO2e – 30%), franchise operations (5,243 tons CO2e – 12%), spectator activities (14,300 tons CO2e – 35%). The following chart displays the results:

Total Carbon Footprint Summary - Stakeholder Groups Breakdown

A majority of the carbon footprint of DLF IPL 2010 is the consequence of activities related to its contractors, while only 23% of the footprint is a direct consequence of direct IPL/IMG managed operations. It is imperative that footprint mitigation strategies account for this aspect of footprint distribution.

Spectators are the most significant stakeholders in terms of contribution to total carbon footprint. Private vehicular travel is the single largest contributing factor – responsible for 6,517 tons CO2e (45%) of the stadium spectator carbon footprint. It is imperative to address this disproportionately heavy reliance on private transport consumed for spectator travel when addressing the overall IPL carbon footprint.

TV viewership-related carbon footprint for DLF IPL 2010 was 358,039 tons CO2e and far outweighed the contributions of any other stakeholder or activity considered within the IPL carbon footprint boundary. This component of carbon footprint, and its root cause–large quantity of consumption of electricity through TV sets–needs to be addressed with greater emphasis on its analysis and mitigation through innovative strategies and interventions in future editions of the IPL.

The impact of stadium construction, one of the primary activities contributing significantly to the IPL footprint, needs to be mitigated by intervening and exploiting opportunities to infuse low-carbon and green architecture and construction practices as the cornerstone of future stadium construction activities at proposed stadiums that are intended for use by the IPL.

Best practice examples for a majority of stakeholder functions within the IPL have been identified and quantified and their initial feasibility assessed. Best practice benchmark replication across the IPL must be pursued as a potent and actionable strategy for optimizing the carbon footprint of the IPL prior to any resource and capital-intensive carbon footprint minimisation strategies.

All interventions must be accompanied by effective communication to all internal and external stakeholders. They must also be in consonance with a well thought-out greening strategy that aims not just at a carbon neutral IPL but sets itself the loftier target of an IPL that is a net carbon sink (an indicative road map is presented in Appendix H of the original report).

Best practice incentivisation through formal programs and its incorporation into contractual negotiations processes with all vendors, contractors and other relevant stakeholders is ascertained to be the most feasible ‘first step’ on the pathway to drastically reducing the carbon footprint of IPL in the forthcoming seasons. Central IPL support and nurturing of competitive franchise behavior through formal recognition of the ‘lowest carbon footprint’ or ‘greenest’ franchise is one illustrative example that may be expanded to envelop all aspects of IPL operations in future editions.

The carbon footprint determined as part of this project phase does not account for the entire life-cycle of the resources consumed and their comprehensive impact on Climate Change and ecology. Accounting for resource acquisition, processing, and disposal impacts could magnify the current extent manifold. A life-cycle analysis (LCA) of all primary resources consumed is essential to ascertain a more comprehensive carbon footprint that tends towards the true climate change impact of IPL. It is recommended that IPL 2011 be assessed on a LCA basis and that preparatory work for an LCA study be commissioned as part of the next phase of the project. The activity boundaries are outlined in the following table:

IPL Activity Boundary Summary

IPL Activity Boundary Summary - 2

It is recommended that the IPL commission ECE to commence a comprehensive carbon footprint minimization analysis as part of a long-term ‘greening program’ (in fulfillment of its MOU with the UNEP’s Sports and Environment Unit) to identify means and alternatives for optimising and minimising its resource intensiveness.

Prior to minimising and offsetting the impact of future IPLs, it is recommended that the IPL commit to neutralise the impact of, as minimum, the four knock-out phase matches of DLF IPL 2010 (estimated to be 3,148 tons). While multiple options for offsetting are available in the conventional Carbon Offset market, the alternatives that result in equitable distribution of benefits to the grassroots stakeholder communities who are imperative to the project’s implementation are preferred as a more potent agent of social and environmental transformation.


The original report can be read here.

Recycle Guru: Carbon Savings Achieved by Recycling

Recycle Guru is an online platform helping citizens recycle their waste by enabling the informal recycling sector. It promotes the more sustainable use of resources to make communities healthier and cleaner and seeks to instill greater dignity in the recycling profession as well as into the perception of citizens who rely upon their services. Recycle Guru initiates the recycling process by collecting paper, plastic, metal, and glass wastes from households in Bangalore.


The motive of this project was to create a tool to estimate the Energy and GHG Emissions (or Carbon Footprint) conservation benefits of recycling versus the business-as-usual option for municipal waste management in India: landfilling. Achieved Energy saving is contextualized in terms of equivalent hour of usage of CFLs (compact fluorescent lamps), ceiling fans, laptop, washing machine, LCD TV, and the equivalent carbon sequestration capacity of trees.

Paper

Paper waste is categorized into following categories: paper sheets, newspaper inserts, newsprint, cardboard, and magazines. The Recycle Guru team observed the percentile contribution of each waste type as the following:

Paper sheets – 95%

Newspaper Inserts – 5%

Cardboard – 60%

Magazines – 40%

Life cycle emission (implies manufacturing from Virgin material, 0% recycled material) of each subcategory mentioned above is as follows:

Life cycle emission of Virgin and Recycled Paper

Using the first order decay method, the emissions from disposal is estimated to be 1.725 kg CO2e/kg of waste. The total emissions saved from recycling is calculated by subtracting the life cycle emissions of the recycled material from the life cycle emissions of the virgin material and then adding the landfilling emissions. The results are displayed in the following table:

Paper: Total Avoided Emission (Per Kg of paper)

Plastic

Plastic waste consists of the following three categories: high value plastic (high density polyethylene), PET bottles (polyethylene terephthalate), low value plastic (low density polyethylene). The life cycle emissions from manufacturing for each subcategory are displayed in the table below.

Life cycle emission of virgin and recycled plastic

Since Degradable Organic Carbon in plastic is almost negligible, methane generation from its disposal in landfills is considered to be Zero. To calculate the avoided emissions from recycling, the same formula as that for paper was used. The results are displayed in the following table:

Plastic: total avoided emission (per kg of plastic)


Metal

Metal waste only contains one category comprising both aluminum and steel. As per the pattern observed so far, percentile contribution of aluminum and steel in metal waste is found to be 75% and 25%, respectively. The life cycle emissions (implies manufacturing from Virgin material, 0% recycled material) of each subcategory mentioned above is as follows:

Life cycle emission of virgin and recycled metal


Since degradable organic carbon in metal is almost negligible, methane generation from its disposal in landfills is considered to be zero. Emission savings for each category is estimated using the same equation as paper and plastic with the results displayed below.

Metal: total avoided emission (per kg of metal)


Glass

Glass waste is categorized into the following categories: beer bottles (brand: Kingfisher), container glass, and generic glass. As observed so far by Recycle Guru team, there were many instances when beer bottles were counted in pieces instead of kilogram. Hence, carbon saving from beer bottles is estimated based on number of pieces taken for recycling. Kingfisher beer bottles (made up of glass) mostly come in 650ml and 330ml. These two
major categories are considered in modeling the carbon saving from piece of each type. Life cycle emission (implies manufacturing from virgin material, 0% recycled material) of each subcategory mentioned above is as follows:

Life cycle emission of Virgin Glass, Life cycle emission of Virgin Beer Bottle Glass

Since degradable organic carbon in metal is almost negligible, methane generation from its disposal in landfills is considered to be zero. Emission savings for each category is estimated using the same equation as paper, plastic, and metal and the results are displayed in the following two tables.

Glass: Total avoided emission (per kg of Glass), Beer Bottle: Total avoided emission (per piece of beer bottle)

As discussed above, the energy saving achieved is expressed in terms of following contexts: CFLs (compact fluorescent lamps), ceiling fans, laptop, washing machine, LCD TV, and the equivalent carbon sequestration capacity of trees. Electricity emission factor (including AT&T Loss) for Bengaluru city is 1.27 kgCO2e/kwh generated. The following table displays the results:

Energy consumption of contexts (appliances)

To find about the assumptions taken and the equations used, the original report can be read here.

How Wipro Reduced Air Travel Emissions

Wipro, an Indian IT services multinational company desiring to become greener, commissioned cBalance to calculate its carbon footprint from business air travel so that strategies could be implemented to reduce these emissions. Wipro has an international presence and a wide geographic base and, thus, must use air transport in order to meet the needs of its clients. In the 2013-14 financial year, Wipro reported 103 thousand tons of CO2e GHG emissions from business travel, which was 13% of its total! Here lied a great opportunity for Wipro to substantially reduce its carbon footprint. So we set out to:

• estimate the carbon emissions factors for domestic and international airlines used by Wipro in 2014-15
• estimate a GHG inventory of Wipro’s business air travel based on the GHG Protocol Corporate Accounting and Reporting Standard,
• make a rankings index of domestic and international airline carriers sorted by their GHG emissions factors,
• recommend a best-in-class air carrier for each sector of company air travel,
• model choices that could reduce GHG emissions (choosing the best airline, reducing the number of stops in a journey)

Not only would this be useful for Wipro, the results of the study could be potentially used by the public at large to reduce their own carbon footprints by simply by making the right decision at the time of booking a flight.

Methodology:
The scope of the project covered all airline business travel, international and domestic, of Wipro during the 2014-15 fiscal year: nearly 500,000 flight legs and about 1.3 billion passenger-km traveled. While about 60% of the flights were domestic, over three quarters of the distance traveled was from international flights.

The GHG emissions inventory was taken following the GHG Protocol’s Corporate Standard, which covers the accounting and reporting of the six greenhouse gases following the Kyoto Protocol: carbon dioxide (CO2), methane (CH4), nitrous oxide (N2O), hydrofluorocarbons (HFCs), perfluorocarbons (PFCs), and sulphur hexafluoride (SF6), and requires adherence to the principles of relevance, completeness, consistency, transparency, and accuracy. Only the first three greenhouse gases, carbon dioxide (CO2), methane (CH4), nitrous oxide (N2O), are considered, as emissions of the other three were below the materiality threshold as defined by the ‘completeness’ principle. Operational boundaries have been specified according to the standard, which entails categorizing emissions as either direct or indirect emissions and choosing the scope for indirect emissions. The measured unit of reference flow is passenger-km of air travel and the unit of analysis is Metric Tonne of CO2e.

Wipro provided the raw data set (flights, airport codes, and carrier codes) and collection began by devising and administering a list of data needs identified by the Standard. Domestic short-haul and long-haul flights were defined as shorter and longer than 500 km, respectively, and international short-haul flights as up to 2,000 km, medium-haul flights as between 2,000 and 5,000 km, and long-haul flights as greater than 5,000 km. cBalance corrected errors and invalid entries in these data.

To develop emission factors, LTO (landing/takeoff) and cruise mode emissions were calculated for all aircraft models. Next, best-case per-passenger emission factors for finite distances were derived for every aircraft model (using maximum passenger capacity and load factor of 1). The same was done for additional finite distances on every aircraft model. Then, the per-passenger emissions for finite distances for each airline was calculated by summing the LTO and cruise-mode emissions (accounting for weighted average airline passenger capacities, airline-wide passenger load factors, and passenger to freight ratios). Finally, the same was done for additional finite distances for each airline. Unfortunately, the relative frequency of operation or share of annual passenger-kms performed by a given aircraft model in an airline’s fleet could not be taken into consideration due to the unavailability of the necessary data regarding domestic airline operations. Incorporating such statistics to arrive at a weighted average would provide a more rigorous approach.

Wipro Air Travel Emissions Reduction Case Study PDF

Scenario Modelling:
cBalance also modelled two different scenario comparisons. The first compared the baseline to the best-in-class and found that if international flights were switched to the best-in-class scenario, it would result in savings of 41% of GHG emissions. For all Wipro’s international flights, the total savings would be 70.44 thousand tonnes of CO2e emissions. For domestic US flights, the best-in-class scenario results in 37% savings (7.47 thousand tonnes), and for domestic Indian flights the savings are 20% (3.92 thousand tonnes). The second compared multi-stop to non-stop flights and found that for international flights, 25% savings resulted from using non-stop flights, and for US domestic flights, the savings were 50%.

Conclusions:
From the fourth quarter of the 2015-16 fiscal year to the first quarter of the next, Wipro reduced the number of segments flown by 8.7%, but GHG emissions decreased 30% cumulatively and 23% per segment. Wipro was able to achieve such huge emission reductions by merely flying 7% fewer multi-stop segments and choosing ‘cleaner’ airlines.
Based on these findings, cBalance recommends that if the difference between the two airlines is less than 15%, pick the non-stop flight on the ‘dirtier’ airline instead of a flight on a ‘cleaner’ airline with a layover. If the difference is greater than 15%, on the other hand, pick a flight on a ‘cleaner’ airline with a layover as opposed to a non-stop flight on a ‘dirtier’ airline.

Air travel is a highly unsustainable activity that should be avoided when possible. Companies are pledging to take advantage of the teleconferencing capabilities enabled by our age of high speed internet to avoid unnecessary face-to-face meetings. When it is impossible to avoid such flights, companies and individuals can choose the optimal airline, reduced number of stops, and economy class, to reduce their GHG emissions. Something as easy as picking a non-stop flight can save dozens of kilograms of CO2e emissions. For some perspective on what that means, a large tree breathes about 12 kilos of CO2 a year. This is an easy way to reduce one’s carbon footprint.

View the Project Report here.

SAI Life Case Study

SAI Life Sciences: An overview of the Energy Audit


Screen Shot 2015-09-17 at 3.19.50 PM

Established in 1999, and utilizing its core group of experts, SAI Life Sciences has been identified to be one of the pioneers in drug manufacturing, development and discovery, solely for Pharma innovators. cBalance Solutions Pvt. Ltd (India) was contacted by them to conduct a complete thermal and electrical energy audit, which was carried over a period of 10-days from the 19th of January 2015 to the 28th of January 2015, in Karnataka.

SAI Life was aiming to achieve the objectives of a ‘green industry’ by conserving their natural resources and reducing their environmental impact from the various operations undertaken by them. In order to achieve this, the energy and related cost conservation potential based on technological interventions, architectural interventions and operational process changes needed to be determined. A comparative analysis of the financial feasibility of the proposed alternatives on a life cycle cost basis, needed establishing. All of the above, along with determining the greenhouse gas (GHG) mitigation potential, in order to reduce SAI Life Sciences’ carbon footprint was undertaken by cBalance Solutions Pvt. Ltd.

MACC Curve


The above curve is identified to be a Marginal Abatement Cost Curve (MACC) for GHG emissions, which is often used as an important component of an institutionalized Sustainability Strategy. It helps in identifying the most cost-effective means of mitigating climate change impact, through several technological interventions and modifications in management practices. The MACC Curve helps in improving the planning of capital expenditure on Energy Efficiency, Water Conservation, Waste Reduction and Management projects, among many others, in a financially sustainable manner, while attaining the desired environmental and socio-economic sustainability benefits. Accumulating the economic benefits from the no-regret options and then stepping into the more challenging interventions is how this is generally done, thereby reducing the financial risk and ensuring longevity of the environmental program on the whole. The costs and benefits are calculated on the basis of real values of the financial parameters and resource conservation benefits of options reflecting the enhancement in technological alternatives.

When calculated for SAI Life, the analysis included the Baseline Performance Management (different power consumption patterns), Compressed Air System, Thermo-pack System, HVAC-Refrigeration System (cooling systems), Boilers and Steam System and other loads (including UPS, Scrubbers and Vacuum ejection system).

After this in-depth analysis it was found that the total current annual electrical energy consumption was approximately 57.6 Lakh kWh/year. In addition to electricity, the Plant was identified to consume 3045 metric tonnes of Coal and Biomass Briquettes for thermal energy and 102,251 liters of diesel annually for power generation. It was also identified that the electricity related emissions were considered to be the most significant supplier to the energy related GHG emissions, contributing 61% of the total emissions. Thus, a method allowing for the mitigation of electricity consumption, in order to prevent climate change on a large scale was suggested to be of a higher priority in comparison to the thermal energy conservation. The HVAC-Refrigeration system was identified to be one of the most critical components of energy consumption, thereby accounting for approximately 33.6% of the total load, followed by the Compressor and Cooling Tower Load. These three sources were identified to cumulatively contribute to approximately 84% of the total energy demand of the plant.

Here is the “MACC for GHG emissions” in table form. We recommend project A to be implemented by SAI Life management first as it offers the highest GHG emission reduction with significant annual savings and low capital cost. Project A is followed by a prioritized list of projects based on these criteria.

Pr. ID System Project Description Capital Cost (INR) Annual Savings (INR) Payback Period (yrs) MAC (Carbon Not Discounted)
A Boiler System Reduce Steam Leakage Loss                  0 7,24,994 0.00 -5084.88
B Boiler System Improve Condensate Recovery to 40%                  0 1,41,369 0.00 -5084.88
C Boiler System Boiler Radiation Loss Reduction        2,31,951 6,57,963 0.35 -4863.87
D Boiler System Flue Gas Waste Heat Recovery      15,00,000 12,65,122 1.19 -4341.57
E Compressed Air System Harnessing the leakage in Nitrogen Distribution Line                  0 8,63,802 0.00 -3744.47
F Compressed Air System Proper Maintenance of Air Compressor Block 06                  0 5,42,321 0.00 -3744.47
G Compressed Air System Proper Maintenance of Nitrogen Air Compressor up to the Air Receiver Tank                  0 2,62,490 0.00 -3744.47
H Compressed Air System Proper Maintenance of Air Compressor Block 01                  0 2,22,807 0.00 -3744.47


Project A: Steam Leakage

Capital Cost: INR 2,31,591, Annual Savings: INR 7,24,994 , Payback period: 0 years, MAC (Carbon not discounted) : -5084.88

Steam Leakage across the Plant was investigated through visual observation and complimented with the use of a Thermal Imaging Camera. Various locations were identified, wherein active steam was found leaking and four spots were identified as steam leakage hotspots upon which the steal leakage reduction strategy should be focused. It is recommended that regular surveillance and an adequate maintenance program is made for the   identification of leaks on pipelines, flanges and joints. Once identified, prompt mitigation strategies should be undertaken in order to harness the low-hanging-fruit energy saving opportunity.


Project B: Condensate Recovery

Capital Cost: 0, Annual Savings: INR 1,41,369, Payback period: 0 years, MAC (Carbon not discounted) : -4863.87

Condensate Recovery from the Steam Distribution System was found to be startlingly low, with only 1,000 liters out of 25,000 TPD being recovered as condensate. This implies an exceptionally low rate of recovery (4%) further implying the rest of the condensate to be drained. Based on observations and experiential learning, it is understood that aiming to achieve a 40% condensate recovery would help in yielding an annual energy savings of approximately 330 GJ per year, eventually saving INR 1.41 Lakhs per year.

Project C: Boiler Radiation Loss Reduction

Capital Cost: 0, Annual Savings: INR 6,47,963 , Payback period: 0.35 years, MAC (Carbon not discounted) : -5084.88

In order to prevent the radiation loss, primary fuel saving opportunities available to the plant include the installation of a solar thermal system, for Boiler Feed Water pre-heating, which is identified to reduce the annual fossil fuel consumption by about 37.7%. A Waste Heat Recovery system could also be installed in order to harness the available energy, reducing the fossil fuel consumption by approximately 30%. Using these technologies would help reducing the annual electricity consumption by 4.2%, yielding energy cost savings of about 12.9% of the current annual energy bill.

The above three projects are examples of the different recommendations that are made in order to reduce the GHG emissions of SAI Life’s operational activities. Once these recommendations are put into place, SAI Life Sciences can achieve the following positive impacts on the environment and its operational costs:

  1. Reduce Greenhouse Gas Emissions by 2,907 metric tonnes of CO2 per year (equivalent to planting approximately 11,628 trees every year)
  2. Conserve 15.3 lakh units of electricity every year (enough to power 1,279 average Indian homes per year)
  3. Reduce its operational cost by INR 1.42 Crore every year
  4. The capital cost for implementing all the proposed projects is approximately INR 1.42 Crore
  5. The payback period for these investments is a very feasible 1.24 years.

cBalance provided a detailed report, which included an in-depth assessment as a part of the energy audit and conservation strategy. The final project report can be found at http://cbalance.in/case-studies/ under the name of SAI Life Sciences.
 

GHG Inventory report for Electricity generation and consumption in India

1. Introduction

This report presents state wise emission factors for electricity generation as well as their respective AT&C losses. To enable accurate calculation of emissions by end users in each state the two factors are also combined to present an emission factor for end user consumption of electricity in each state in India. This report, brought out by cBalance Solution Pvt. Ltd., also highlights comparative emissions of all states taking into account each ones specific emission factor which with further analysis can be used as a tool for progressive national policy making in order to help India achieve its goal of 20-25% emissions reduction from 2005 levels by 2020.

1.1 STATE OF THE POWER SECTOR IN INDIA (2009-10)

Though the total ex-bus energy availability increased by 8.0% over the previous year and the peak met increased by 7.5%, there were still significant shortages in the country both in terms of both energy and peaking availability as given below:


Energy (MU) Peak (MW)
Requirement

8,30,594

1,19,166

Availability

7,46,644

1,04,009

Shortage

83,950

15,157

% shortage of requirement

10.10%

12.70%


The energy requirement registered a growth of 6.9% during the year against the projected growth of 8.2% and Peak demand registered a growth of 8.5% against the projected growth of 8.2%.


1.2 State wise contribution in electricity generation and consumption

graph1

About 50% of states & union territories are not self sufficient in electricity generation and are dependent on others states to fulfill their requirements.

Maharashtra is highest generator and consumer of electricity with Gujarat, Andhra Pradesh and Tamil Nadu close behind. Chattisgarh exports the largest amount of electricity at 4941 GWh while Tamil Nadu imports 4046 GWh which is the highest in the country.


2. Scope and Methodology

The data is sourced from CEA reports and calculations are done as outlined in the IPCC 2006 guidelines.

Electricity generation factor (kgCO2e/kWh)

(Emission from fossil fuels used for generation + Emission from electricity imported from other states – emission from electricity exported to other states) / Total electricity consumed by state

  • Fossil fuel electricity generation technologies include coal, thermal, Gas turbine generation and Diesel Generators.
  • Emissions from renewable energy technologies are considered to be zero.


AT&C Losses factor (kgCO2e/kWh)

(Total electricity generated by state x adjusted electricity generation factor of state x % of AT&C losses in the state)/ Total electricity consumed by state)

Adjusted generation emissions are Total electricity consumed * emission factor adjusted for import and export of electricity

End user specific emission factor (kgCO2e/kWh)

Electricity generation factor + AT&C losses factor


3. Results:

3.1 State wise Emission Factor of Electricity


The following results stand out from the above table:

  1. Jharkhand has the highest emission factor for generation at 1.21 kgCO2e/kWh and also the highest emission factor after adjusting for import and export of electricity which is 1.33 kgCo2e/kWh

2. Bihar has the highest AT&C losses in the system due to which it has the highest emission factor for AT&C losses which is 0.86 kgCO2e/kWh. This also results in it having the highest emission factor for end user consumption of electricity at 2.1 kgCO2e/kWh.

3. The average India electricity generation emission factor is 0.89 kgCO2e/kWh and average India AT&C loss emission factor is 0.30 kgCO2e/kWh.

4. States that import electricity are liable for the corresponding proportion of emissions of each state from where electricity is imported. Hence some states like Sikkim, Assam, Manipur, Nagaland in particular appear to be “dirtier” i.e. their emission factors are quite high because they are importing electricity from states which have a high electricity generation emission factor.


3.2 State wise end user consumption emission factor of electricity


graph2

Graph 1: State wise end user electricity emission factor

In the above graph we can see almost 45% of states have an end user emission factor that is higher than the India avg. emission factor of electricity generation.

In many cases we can see that states have a low adjusted emission factor for generation but due to high AT&C losses their end user emission factor is higher than the India avg. emission factor. This point is illustrated in detail in the graph below.


3.3 State wise AT&C losses and emission factors for AT&C losses


graph3

Graph 2: State wise AT&C % losses and AT&C loss emission factors

As shown above the India average AT&C % loss is 25%. Also there is a big variation in the % losses between the grids specifically such as the South grid and NEWNE grid.

Highest AT&C % loss of 67% is recorded from Jammu & Kashmir and the lowest one recorded from D.&N. Haveli which is 11%.

About 40% states have higher AT&C system losses than the India average which points to a huge potential to save electricity with up gradation of technology and proper maintenance of transmission and distribution systems. It is also noticeable that states with difficult terrain such as hills and forests have higher AT&C losses than other states.

Another important fact visible in the graph above is that the AT&C loss emission factor is not only dependant on the quantum of losses but also on the source of electricity generation. Hence a state with low AT&C losses but “dirtier” sources of electricity generation could still have an AT&C emission factor higher than that of a state with higher losses but cleaner sources of generation. For e.g. Arunachal Pradesh has extremely high losses of about 47% but since most of its electricity is generated through hydel power its AT&C factor is less than 0.1 kgCO2e/kWh. Whereas Jharkhand has losses of only about 23% but its AT&C emission factor is about 0.3 kgCO2e/kWh since most of its electricity is generated from coal.


3.4 State wise contribution in electricity generation and emission from electricity generation


graph4

Graph 3: State wise % contribution in total electricity generation and % contribution in total emission from generation of electricity (all sources)


In the above graph we can see that a majority i.e. 23 states and UT’s contribute less than 1% each to India’s generation and emission stock. The majority generators are Maharashtra, & Gujarat and they are responsible for 9.2% and 6.8% of generation stock and 10.2% and 6.3% of emissions respectively.

Karnataka also has the lowest percentage of emissions of 2.9% with respect to it percentage of generation stock of 4.7% while Uttar Pradesh has the highest percentage of emissions of 4.3% over its percentage contribution to the generation stock at 3.3%.


4. Conclusion

A majority of emissions from the power sector are due to usage of coal as a primary medium for electricity generation (68%). There is a large potential to reduce emissions through usage of better quality of coal, more efficient technologies as well as moving to cleaner technologies such as thermal, hydro, solar etc. But these scenarios depend on various factors such as cost, geographical location, availability of raw materials etc and hence are hard to predict.

But as shown earlier, states with relatively clean generation technologies still have quite a poor end user emission factor due to major AT&C losses. This is a “low hanging fruit” opportunity for states to drastically improve their quality of electricity and emission factors. For e.g. if all states whose AT&C losses lie below the India avg. of 25% move up to atleast the average, an emission reduction of approximately 15 MTCO2e is possible. In the best case scenario if all states improve their efficiency of AT&C to the world average of 8.4% phenomenal savings of 115 MTCO2e are possible which is a reduction of about 67% of emissions due to AT&C losses. These steps can go a long way in helping India achieve its goal of 20-25% reduction in emissions over 2005 levels by 2020.


[1] Data Source : CEA – All India Electricity Statistics – General Review 2011

[2] Data Source : CEA – All India Electricity Statistics – General Review

2011

[3] Chandigarh is exporting more quantity than total generation so on the conservative principal assumed that one State whatever is importing within that it is consuming electricity embedded with higher emission.

[4] Dadra & Nagar Haveli and Daman &

Diu Electricity GHG EF (except AT&C Loss GHG EF) is same because it has been calculated on combined level due to non availability of quantity of exported and imported electricity.

[5] Sikkim is exporting more quantity than total generation so on the conservative principal assumed that one State whatever is importing within that it is consuming electricity embedded with higher emission.