

SAI Life Case Study
SAI Life Sciences: An overview of the Energy Audit

Established in 1999, and utilizing its core group of experts, SAI Life Sciences has been identified to be one of the pioneers in drug manufacturing, development and discovery, solely for Pharma innovators. cBalance Solutions Pvt. Ltd (India) was contacted by them to conduct a complete thermal and electrical energy audit, which was carried over a period of 10-days from the 19th of January 2015 to the 28th of January 2015, in Karnataka.
SAI Life was aiming to achieve the objectives of a ‘green industry’ by conserving their natural resources and reducing their environmental impact from the various operations undertaken by them. In order to achieve this, the energy and related cost conservation potential based on technological interventions, architectural interventions and operational process changes needed to be determined. A comparative analysis of the financial feasibility of the proposed alternatives on a life cycle cost basis, needed establishing. All of the above, along with determining the greenhouse gas (GHG) mitigation potential, in order to reduce SAI Life Sciences’ carbon footprint was undertaken by cBalance Solutions Pvt. Ltd.
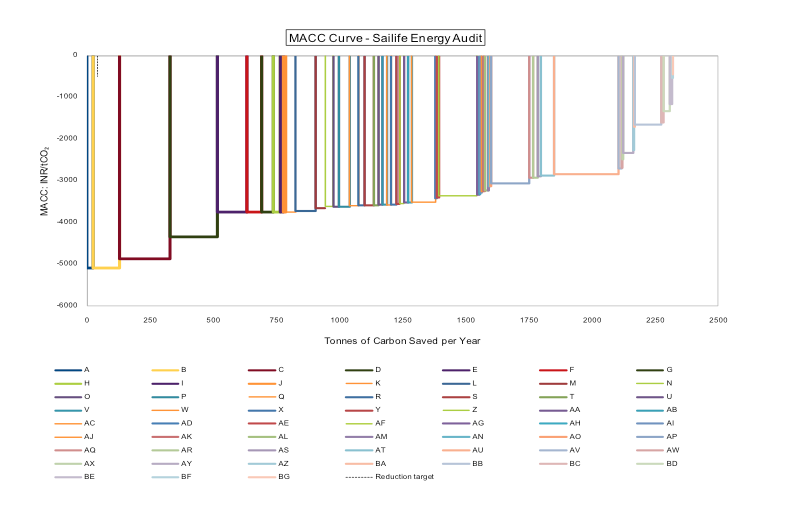
The above curve is identified to be a Marginal Abatement Cost Curve (MACC) for GHG emissions, which is often used as an important component of an institutionalized Sustainability Strategy. It helps in identifying the most cost-effective means of mitigating climate change impact, through several technological interventions and modifications in management practices. The MACC Curve helps in improving the planning of capital expenditure on Energy Efficiency, Water Conservation, Waste Reduction and Management projects, among many others, in a financially sustainable manner, while attaining the desired environmental and socio-economic sustainability benefits. Accumulating the economic benefits from the no-regret options and then stepping into the more challenging interventions is how this is generally done, thereby reducing the financial risk and ensuring longevity of the environmental program on the whole. The costs and benefits are calculated on the basis of real values of the financial parameters and resource conservation benefits of options reflecting the enhancement in technological alternatives.
When calculated for SAI Life, the analysis included the Baseline Performance Management (different power consumption patterns), Compressed Air System, Thermo-pack System, HVAC-Refrigeration System (cooling systems), Boilers and Steam System and other loads (including UPS, Scrubbers and Vacuum ejection system).
After this in-depth analysis it was found that the total current annual electrical energy consumption was approximately 57.6 Lakh kWh/year. In addition to electricity, the Plant was identified to consume 3045 metric tonnes of Coal and Biomass Briquettes for thermal energy and 102,251 liters of diesel annually for power generation. It was also identified that the electricity related emissions were considered to be the most significant supplier to the energy related GHG emissions, contributing 61% of the total emissions. Thus, a method allowing for the mitigation of electricity consumption, in order to prevent climate change on a large scale was suggested to be of a higher priority in comparison to the thermal energy conservation. The HVAC-Refrigeration system was identified to be one of the most critical components of energy consumption, thereby accounting for approximately 33.6% of the total load, followed by the Compressor and Cooling Tower Load. These three sources were identified to cumulatively contribute to approximately 84% of the total energy demand of the plant.
Here is the “MACC for GHG emissions” in table form. We recommend project A to be implemented by SAI Life management first as it offers the highest GHG emission reduction with significant annual savings and low capital cost. Project A is followed by a prioritized list of projects based on these criteria.
| Pr. ID | System | Project Description | Capital Cost (INR) | Annual Savings (INR) | Payback Period (yrs) | MAC (Carbon Not Discounted) |
| A | Boiler System | Reduce Steam Leakage Loss | 0 | 7,24,994 | 0.00 | -5084.88 |
| B | Boiler System | Improve Condensate Recovery to 40% | 0 | 1,41,369 | 0.00 | -5084.88 |
| C | Boiler System | Boiler Radiation Loss Reduction | 2,31,951 | 6,57,963 | 0.35 | -4863.87 |
| D | Boiler System | Flue Gas Waste Heat Recovery | 15,00,000 | 12,65,122 | 1.19 | -4341.57 |
| E | Compressed Air System | Harnessing the leakage in Nitrogen Distribution Line | 0 | 8,63,802 | 0.00 | -3744.47 |
| F | Compressed Air System | Proper Maintenance of Air Compressor Block 06 | 0 | 5,42,321 | 0.00 | -3744.47 |
| G | Compressed Air System | Proper Maintenance of Nitrogen Air Compressor up to the Air Receiver Tank | 0 | 2,62,490 | 0.00 | -3744.47 |
| H | Compressed Air System | Proper Maintenance of Air Compressor Block 01 | 0 | 2,22,807 | 0.00 | -3744.47 |
Project A: Steam Leakage
Capital Cost: INR 2,31,591, Annual Savings: INR 7,24,994 , Payback period: 0 years, MAC (Carbon not discounted) : -5084.88
Steam Leakage across the Plant was investigated through visual observation and complimented with the use of a Thermal Imaging Camera. Various locations were identified, wherein active steam was found leaking and four spots were identified as steam leakage hotspots upon which the steal leakage reduction strategy should be focused. It is recommended that regular surveillance and an adequate maintenance program is made for the identification of leaks on pipelines, flanges and joints. Once identified, prompt mitigation strategies should be undertaken in order to harness the low-hanging-fruit energy saving opportunity.
Project B: Condensate Recovery
Capital Cost: 0, Annual Savings: INR 1,41,369, Payback period: 0 years, MAC (Carbon not discounted) : -4863.87
Condensate Recovery from the Steam Distribution System was found to be startlingly low, with only 1,000 liters out of 25,000 TPD being recovered as condensate. This implies an exceptionally low rate of recovery (4%) further implying the rest of the condensate to be drained. Based on observations and experiential learning, it is understood that aiming to achieve a 40% condensate recovery would help in yielding an annual energy savings of approximately 330 GJ per year, eventually saving INR 1.41 Lakhs per year.
Project C: Boiler Radiation Loss Reduction
Capital Cost: 0, Annual Savings: INR 6,47,963 , Payback period: 0.35 years, MAC (Carbon not discounted) : -5084.88
In order to prevent the radiation loss, primary fuel saving opportunities available to the plant include the installation of a solar thermal system, for Boiler Feed Water pre-heating, which is identified to reduce the annual fossil fuel consumption by about 37.7%. A Waste Heat Recovery system could also be installed in order to harness the available energy, reducing the fossil fuel consumption by approximately 30%. Using these technologies would help reducing the annual electricity consumption by 4.2%, yielding energy cost savings of about 12.9% of the current annual energy bill.
The above three projects are examples of the different recommendations that are made in order to reduce the GHG emissions of SAI Life’s operational activities. Once these recommendations are put into place, SAI Life Sciences can achieve the following positive impacts on the environment and its operational costs:
- Reduce Greenhouse Gas Emissions by 2,907 metric tonnes of CO2 per year (equivalent to planting approximately 11,628 trees every year)
- Conserve 15.3 lakh units of electricity every year (enough to power 1,279 average Indian homes per year)
- Reduce its operational cost by INR 1.42 Crore every year
- The capital cost for implementing all the proposed projects is approximately INR 1.42 Crore
- The payback period for these investments is a very feasible 1.24 years.
cBalance provided a detailed report, which included an in-depth assessment as a part of the energy audit and conservation strategy. The final project report can be found at http://cbalance.in/case-studies/ under the name of SAI Life Sciences.