cBalance has been engaging with Wipro, an Indian Information Technology Services Corporation, to estimate their GHG emissions from air travel since 2015.
The objective of the project has been to estimate GHG emissions from air travel, analyze Wipro’s flying patterns, estimate possible reductions in GHG emissions and recommend strategies to reduce GHG emissions.
The analysis was adhered to GHG Protocol’s Corporate Standard, accompanied by IPCC Guidelines 2006 to calculate airline specific emission factors (insert footnote)
Following the equation:
GHG Emissions = Activity Data x Emission Factor
Here, the Activity Data was the distance between Airport A to Airport B, calculated using great circle equation.
Emission factor was given in terms of kg CO2e / pax-km for each airline, distinguished based on whether the flight was International or Domestic and whether the flight was short, medium or long haul (this was determined based on the distance).
For FY 2014-2015 estimated GHG emissions were 170.1 thousand tonnes CO2e, with 1,269.8 million pax-km traveled across 5.0 lac flights
For FY 2015-2016 estimated GHG emissions were 152.9 thousand tonnes CO2e, with 1,134.4 million pax-km traveled across 4.7 lac flights
During these two cycle of analysis, other than estimating the GHG emissions from air travel, the major emphasis was on quantifying reduction potential and study reduction strategies. This was achieved by modeling two scenarios :
Best-In-Class Switch :
The goal of this scenario was to determine, for a given flight, the best airline in terms of emission factor ranking for its specified route. This helped us and Wipro quantify reduction potential just by switching over to a more efficient airline.
The estimated GHG emissions reduction from Best-In-Class switch for FY 2014-2015 were 59.9 thousand tonnes CO2e and for FY 2015-2016 were 36.9 thousand tonnes CO2e
Multi-stop to Non-stop Switch :
The goal of this scenario was to determine possible reductions in GHG emissions switching from a multi-stop flight to a non-stop flight.
The estimated GHG emissions reduction from Multi-stop to Non-stop switch for FY 2014-2015 were 19.4 thousand tonnes CO2e and for FY 2015-2016 were 11.7 thousand tonnes CO2e
In total, 79.3 thousand tonnes CO2e and 48.6 thousand tonnes CO2e reductions were estimated respectively for FY 2014-2015 and FY 2015-2016
A white paper titled Reducing Air Travel Emissions can be read here, where we have ranked airlines based on their GHG Emission Factor.
FY 2016-2017 & FY 2017-2018
For FY 2016-2017 estimated GHG emissions were 130.2 thousand tonnes CO2e, with 923.7 million pax-km traveled across 2.1 lac flights
For FY 2017-2018 estimated GHG emissions were 116.5 thousand tonnes CO2e, with 836.8 million pax-km traveled across 1.9 lac flights
Since the recommendations of flying the best-in-class airline, flying non-stop over multi-stop and choosing to travel via railways and/or use video calling services were already implemented, during these cycle only emission estimation was conducted on the business unit level.
For future development, the goal is to implement emissions and a financial budgeting system with respect to flying on a business unit level with the idea that it would create responsible air travel amongst employees.
Details on the Business Units wise emissions for FY 2016-2017 can be viewed here.
Furthermore, click here to view a comparison between Economy vs Business Class emissions between FY 2016-2017 and FY 2017-2018
Eliminate Carbon Emissions (ECE) Pvt. Ltd was contracted by the IPL Management upon the recommendation of the United Nations Environment Program (UNEP) to calculate the IPL’s annual carbon footprint (i.e. an inventory of the total greenhouse gas emissions – GHGs – that contribute to climate change, resulting from direct and indirect resource consumption through DLF IPL 2010’s annual operations).
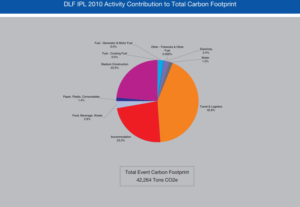
The total carbon footprint of DLF IPL 2010 was estimated to be 42,264 tons CO2e. DLF IPL 2010’s Carbon Footprint can be thought of as requiring 169,055 trees to ‘neutralise’ its impact on climate change over a period of 20 years. This equates to approximately 2,818 trees per match.
The following activities comprise its carbon Footprint, in order of decreasing magnitude: travel and logistics (18,073 tons CO2e – 42.8%), stadium construction (9,932 tons CO2e – 23.5%), luxury hotel accommodation (9,927 tons CO2e – 23.5%) , food, beverage, and waste (1,201 tons CO2e – 2.8%) and electricity (996 tons CO2e – 2.4%). These results are displayed in the chart below:
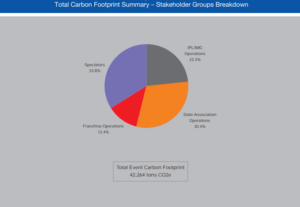
Relative stakeholder contributions to the DLF IPL 2010 Carbon Footprint are: IPL/IMG Operations (9,861 tons CO2e – 23%), state association operations (12,861 tons CO2e – 30%), franchise operations (5,243 tons CO2e – 12%), spectator activities (14,300 tons CO2e – 35%). The following chart displays the results:
A majority of the carbon footprint of DLF IPL 2010 is the consequence of activities related to its contractors, while only 23% of the footprint is a direct consequence of direct IPL/IMG managed operations. It is imperative that footprint mitigation strategies account for this aspect of footprint distribution.
Spectators are the most significant stakeholders in terms of contribution to total carbon footprint. Private vehicular travel is the single largest contributing factor – responsible for 6,517 tons CO2e (45%) of the stadium spectator carbon footprint. It is imperative to address this disproportionately heavy reliance on private transport consumed for spectator travel when addressing the overall IPL carbon footprint.
TV viewership-related carbon footprint for DLF IPL 2010 was 358,039 tons CO2e and far outweighed the contributions of any other stakeholder or activity considered within the IPL carbon footprint boundary. This component of carbon footprint, and its root cause–large quantity of consumption of electricity through TV sets–needs to be addressed with greater emphasis on its analysis and mitigation through innovative strategies and interventions in future editions of the IPL.
The impact of stadium construction, one of the primary activities contributing significantly to the IPL footprint, needs to be mitigated by intervening and exploiting opportunities to infuse low-carbon and green architecture and construction practices as the cornerstone of future stadium construction activities at proposed stadiums that are intended for use by the IPL.
Best practice examples for a majority of stakeholder functions within the IPL have been identified and quantified and their initial feasibility assessed. Best practice benchmark replication across the IPL must be pursued as a potent and actionable strategy for optimizing the carbon footprint of the IPL prior to any resource and capital-intensive carbon footprint minimisation strategies.
All interventions must be accompanied by effective communication to all internal and external stakeholders. They must also be in consonance with a well thought-out greening strategy that aims not just at a carbon neutral IPL but sets itself the loftier target of an IPL that is a net carbon sink (an indicative road map is presented in Appendix H of the original report).
Best practice incentivisation through formal programs and its incorporation into contractual negotiations processes with all vendors, contractors and other relevant stakeholders is ascertained to be the most feasible ‘first step’ on the pathway to drastically reducing the carbon footprint of IPL in the forthcoming seasons. Central IPL support and nurturing of competitive franchise behavior through formal recognition of the ‘lowest carbon footprint’ or ‘greenest’ franchise is one illustrative example that may be expanded to envelop all aspects of IPL operations in future editions.
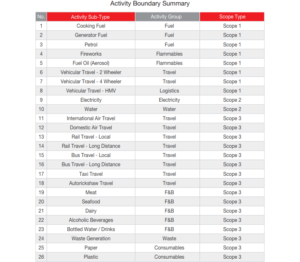
The carbon footprint determined as part of this project phase does not account for the entire life-cycle of the resources consumed and their comprehensive impact on Climate Change and ecology. Accounting for resource acquisition, processing, and disposal impacts could magnify the current extent manifold. A life-cycle analysis (LCA) of all primary resources consumed is essential to ascertain a more comprehensive carbon footprint that tends towards the true climate change impact of IPL. It is recommended that IPL 2011 be assessed on a LCA basis and that preparatory work for an LCA study be commissioned as part of the next phase of the project. The activity boundaries are outlined in the following table:
It is recommended that the IPL commission ECE to commence a comprehensive carbon footprint minimization analysis as part of a long-term ‘greening program’ (in fulfillment of its MOU with the UNEP’s Sports and Environment Unit) to identify means and alternatives for optimising and minimising its resource intensiveness.
Prior to minimising and offsetting the impact of future IPLs, it is recommended that the IPL commit to neutralise the impact of, as minimum, the four knock-out phase matches of DLF IPL 2010 (estimated to be 3,148 tons). While multiple options for offsetting are available in the conventional Carbon Offset market, the alternatives that result in equitable distribution of benefits to the grassroots stakeholder communities who are imperative to the project’s implementation are preferred as a more potent agent of social and environmental transformation.
Recycle Guru is an online platform helping citizens recycle their waste by enabling the informal recycling sector. It promotes the more sustainable use of resources to make communities healthier and cleaner and seeks to instill greater dignity in the recycling profession as well as into the perception of citizens who rely upon their services. Recycle Guru initiates the recycling process by collecting paper, plastic, metal, and glass wastes from households in Bangalore.
The motive of this project was to create a tool to estimate the Energy and GHG Emissions (or Carbon Footprint) conservation benefits of recycling versus the business-as-usual option for municipal waste management in India: landfilling. Achieved Energy saving is contextualized in terms of equivalent hour of usage of CFLs (compact fluorescent lamps), ceiling fans, laptop, washing machine, LCD TV, and the equivalent carbon sequestration capacity of trees.
Paper
Paper waste is categorized into following categories: paper sheets, newspaper inserts, newsprint, cardboard, and magazines. The Recycle Guru team observed the percentile contribution of each waste type as the following:
Paper sheets – 95%
Newspaper Inserts – 5%
Cardboard – 60%
Magazines – 40%
Life cycle emission (implies manufacturing from Virgin material, 0% recycled material) of each subcategory mentioned above is as follows:
Using the first order decay method, the emissions from disposal is estimated to be 1.725 kg CO2e/kg of waste. The total emissions saved from recycling is calculated by subtracting the life cycle emissions of the recycled material from the life cycle emissions of the virgin material and then adding the landfilling emissions. The results are displayed in the following table:
Plastic
Plastic waste consists of the following three categories: high value plastic (high density polyethylene), PET bottles (polyethylene terephthalate), low value plastic (low density polyethylene). The life cycle emissions from manufacturing for each subcategory are displayed in the table below.
Since Degradable Organic Carbon in plastic is almost negligible, methane generation from its disposal in landfills is considered to be Zero. To calculate the avoided emissions from recycling, the same formula as that for paper was used. The results are displayed in the following table:
Metal
Metal waste only contains one category comprising both aluminum and steel. As per the pattern observed so far, percentile contribution of aluminum and steel in metal waste is found to be 75% and 25%, respectively. The life cycle emissions (implies manufacturing from Virgin material, 0% recycled material) of each subcategory mentioned above is as follows:
Since degradable organic carbon in metal is almost negligible, methane generation from its disposal in landfills is considered to be zero. Emission savings for each category is estimated using the same equation as paper and plastic with the results displayed below.
Glass
Glass waste is categorized into the following categories: beer bottles (brand: Kingfisher), container glass, and generic glass. As observed so far by Recycle Guru team, there were many instances when beer bottles were counted in pieces instead of kilogram. Hence, carbon saving from beer bottles is estimated based on number of pieces taken for recycling. Kingfisher beer bottles (made up of glass) mostly come in 650ml and 330ml. These two
major categories are considered in modeling the carbon saving from piece of each type. Life cycle emission (implies manufacturing from virgin material, 0% recycled material) of each subcategory mentioned above is as follows:
Since degradable organic carbon in metal is almost negligible, methane generation from its disposal in landfills is considered to be zero. Emission savings for each category is estimated using the same equation as paper, plastic, and metal and the results are displayed in the following two tables.
As discussed above, the energy saving achieved is expressed in terms of following contexts: CFLs (compact fluorescent lamps), ceiling fans, laptop, washing machine, LCD TV, and the equivalent carbon sequestration capacity of trees. Electricity emission factor (including AT&T Loss) for Bengaluru city is 1.27 kgCO2e/kwh generated. The following table displays the results:
To find about the assumptions taken and the equations used, the original report can be read here.
The Orange County Foundation is a group of individuals who have experience in eco-friendly architecture and civil construction, and focus on sustainable urban development. The foundation has developed a self-sufficient green housing project at Pashan, Pune–the first of its kind–and is developing another green housing project, ‘Royal Orange County’ (ROC), at Rahatani Pune. This project involves eight multi-storied buildings, consisting a total of 353 residential flats. The ROC has adopted a number of sustainable and environment-friendly options, such as eco friendly architectural design buildings, renewable energy, waste management, wastewater management and low-carbon embodied construction and building materials.
Project Objectives:
Internal capacity building and skill development for the Orange County Foundation team to calculate the carbon footprint of their construction projects
License of authenticated database for India specific emission factors related to construction and building materials, electricity & energy, mobility, AFLOU, waste, and wastewater to map the environmental performance and sustainability impact of the Orange County Foundation’s projects
Life-cycle process mapping of the ROC construction to develop a toolkit for carbon ERP integration into their system
Carbon Footprinting of the design and construction phase of the ROC project
cBalance’s Roles:
Annual Enterprise-Use License for cBalance Carbon Emission Factor Database (CEFD) – cBalance authorized yearly subscription of the CEFD tool to the Orange County Foundation to map the carbon footprint of projects using India-specific emission factors of construction and building materials, energy, mobility, AFLOU, waste and wastewater.
Training to Orange County Foundation Team for Assessment of Carbon Footprint – cBalance team provided 16 hours extensive training to the Orange County Foundation team on the topic of carbon footprinting, life-cycle of a construction project and introduction to common carbon metrics for building operations. In addition, cBalance provided training on the CEFD tool and instructed how the CEFD can be helpful to choose sustainable and low-carbon activity or material alternatives.
Life-cycle Process Mapping and Toolkit Development for Carbon Footprint – The cBalance team visited the construction site and project office of the ROC. Through a site audit and interviews with project officers, cBalance mapped the activities related to the design and construction phase of the ROC. Thereafter, cBalance developed a toolkit that integrated into their existing system for mapping the life-cycle carbon footprint of the ROC and future projects.
Carbon Footprinting of Royal Orange County Residential Housing Project – The cBalance team collected data from the ROC on deforestation, electricity, fuels, and construction and building materials consumption of the construction phase of the ROC and calculated the construction phase carbon footprint using India-specific GHG emission factors. Finally, the cBalance team presented the carbon footprint analysis to the board of the Orange County Foundation.
Results:
Subscription to the CEFD and in-person training empowered Orange County Foundation team to:
calculate the carbon footprint of their projects using India-specific GHG emission factors
assess life-cycle environmental performance and sustainable impact of their projects
choose sustainable alternatives over conventional construction and building material
compare environmental performances of two different construction projects
create a baseline and frame future strategies to reduce the carbon footprint
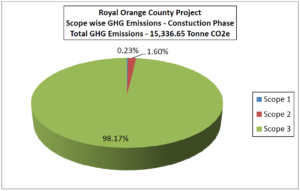
The Orange County Foundation team calculated the carbon footprint of the ROC construction phase and successfully achieved a 15% reduction in GHG emissions compared with previous projects.
The above graph demonstrates this 15% reduction. Below, the GHG emissions from the construction phase categorized by scope are displayed. As is obvious, almost all of the emissions were Scope 3.
This blog post discusses the results of a report written in 2011 by Vivek Gilani and Dr. Amit Garg on the subject of the potential for improving the coal efficiency and GHG intensity of the steel sector in India.
Facts:
The domestic cola production target for 2011-12 was 554 mt. India added 1660 MW generation capacity in July of 2011 (all thermal power), and Indian plants exceeded their power generation target that month. Additionally, Coal India Ltd (CIL) reported a 64.06% rise in profit after tax (PAT) during the first quarter (April-June) of 2011-12.
India’s coal import in 2011-12 was predicted to be 137.03 mt, with some ports seeing huge increases in the amount of incoming imported coal. The import of coking coal through Paradip port on the eastern coast of India increased from 258,479 in June 2011 to 668,574 in July, an increase of 410,095 tons, or 159%. Imports of PCI coal through Vizag port in July 2011 stood at 113,467 tons, 86,764 tons more than the 26,703 tons imported in June 2011. And the imports of Low Ash Metallurgical (LAM) coke through Paradip port in the month of July 2011 rose sharply to 60,590 tons, compared with 6,000 tons in June 2011
Domestic mining has many environmental impacts, including the issue of land usage. 171 coal mining proposals involving 28,862 hectares of forest land are awaiting forestry clearance as of June 30, 2011. 44 projects of Coal India Ltd (CIL) stuck under Comprehensive Environment Pollution India (CEPI) norms introduced b they MoEF.
Question:
Can the most efficient users of coal in India’s steel sector help India:
increase its energy independence
meet its climate change commitments
and even save some forests?
Trends:
The following chart displays the GHG intensity of production in the Indian steel sector.
As is evident from the results, coking coal is the largest contributor at 40%, with coal being the second largest at 26%. Steam turbines and grid electricity, at 12%, were also significant.
The following table describes the GHG intensity of production in various steel companies throughout the sector.
The following table, on the other hand, depicts the coal efficiency and GHG intensity enhancement of Indian steel companies. In the years 2008-2010, they substantially exceeded their COP15 commitments regarding GHG mitigation.
The following graph displays the coal savings, GHG intensity reduction, and COP15 commitment opportunities of the steel sector for the same years.
The following chart displays the abatement potential for India’s steel sector for each measure, along with the necessary assumptions. Potentially, the 2030 projected emissions of 735 million tons of CO2e per year could be reduced to 573 million tons. Energy efficiency processes alone have an abatement potential of 73 million tons, shifting to scrap-based EAF has a potential of 21 million tons, and shifting to gas-based DRI, 17 million tons.
Measures:
Energy Efficiency can be improved through improving processes, namely sinter plant heat recovery and coal moisture control. Pulverized coal injection, coke dry quenching, and recovering waste heat also helps optimize energy use.
Savings can come from shifting fuel as well, substituting coke used in BF/BOF furnaces with fuel based on biomass (charcoal). Replacing 10% of coke as the primary blast furnace tool can also make a very sizable contribution.
Technology chances can have a big impact. One example is direct smelting, which removes the need for coking plants. (There are issues with these technologies that need to be resolved, of course). Another is scrap-based steel making, which uses 1/3 of the energy required by standard blast furnaces. The issue here is that if 10% of the total production moved to this system, 70% of India’s steel would need to be recycled, which would come with an economic cost. Lastly, gas-based direct reduced iron and cogeneration, i.e. recovering gas from the BOF/BF process and cleaning and using it for power generation, can also help to reduce emissions.
Energy independence and the Indian steel sector:
Coking coal prices were $129 a ton in 2009-10 but increased to $225 a ton in the second quarter beginning in July 2010. India has a very high dependency on Australia for coking coal and would need 2.4 billion tonnes of steel/yr by 2030, meaning India would need to import 40% of its coal needs.
Conclusion/way forward:
The best practice gap was achieved by the cement industry in its production from coal, increasing the GHG intensity ration from 13.4 to 15.7 in 3 years. Best practice technology (BPT) replication is achievable using off-the-shelf technologies in India. BPT replication in Steel Industry alone can yield 36 million tons of coal savings and reduce India’s imports drastically as well as help India achieve more than 100% of its GHG emissions commitment to COP15 (reducing the GHG intensity of GDP by 20%-25% by 2020). We are not anti-coal as fuel but, rather, a rational promoter of the roadmap to use India’s and the globe’s diminishing coal supplies more efficiently. The most pressing needs are process optimization technology sharing throughout the steel industry and active promotion and incentivization of efficient users of coal and low-GHG intensity steel on platforms such as coal junction and metal junction.
This blog post summarizes the carbon footprint calculation conducted by Eliminate Carbon Emissions Pvt. Ltd to measure the greenhouse gas emissions of the Neemrana Fort Palace Hotel (pictured below).
Goals and Scope:
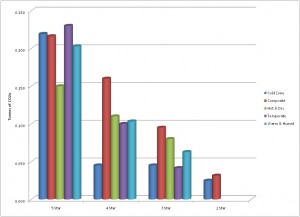
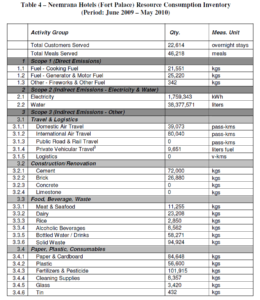
The project goals were to determine with the great degree of accuracy possible the total resource consumption inventory, total carbon footprint, and the activity-differentiated carbon footprint of the Neemrana Fort Palace Hotel’s operations. The activity boundaries were categorized as Scope 1, 2, and 3 emissions, with the results displayed in the following table.
The stakeholders were defined as the primary realizer (Neemrana Fort) and the fruit jam production facility (Nainital). While many activities resulted in direct emissions (Scope 1), some resulted in indirect emissions through the generation of electricity (Scope 2), and the emissions caused by the production of goods used (Scope 3) must be included as well in a GHG inventory. The emissions of the latter group were calculated using the life cycle assessment.
Results:
The following table presents the extrapolated aggregated resource consumption inventory for the Neemrana Fort Palace Hotel.
This resource consumption resulted in a total of 3,282 tons CO2e of 0.145 tons CO2e per stay from the period of June 2009 to May 2010. The results, categorized by activity, are displayed below.
As is obvious from the results, the vast majority of the greenhouse gas emissions came from the generation of electricity (83.5%). While nothing else came close, the GHG emissions from water (2.3%), generator usage (2.5%) and meat and seafood (2.6%) were also significant. Food, beverage, and waste as a category contributed 6.2% of the total emissions. The same results are displayed in the pie chart below.
Conclusion:
With electricity generation being responsible for so much of the hotel’s GHG emissions, efforts to reduce these emissions should focus on reducing electricity consumption. Staff and guests can work together to use less electricity through a number of voluntary (or mandatory) measures.
This blog post summarizes the carbon footprint calculation (i.e. an inventory of the total Greenhouse Gas Emissions (GHGs) that contribute to Climate Change resulting from direct and indirect resource consumption through event activities) of the IIM(A)’s CHAOS 2010 annual cultural festival, which was contracted to Eliminate Carbon Emissions Pvt. Ltd by the festival’s Organizing Committee.
Goals:
The project goals were to determine, with the great degree of accuracy possible, the following for CHAOS 2010:
Boundaries for the Carbon Footprint Calculation process were defined in consultation with CHAOS 2010 Management. Defining boundaries involved two key-decision making areas: activities to be included (i.e. defining a comprehensive yet manageable set of resources who’s consumption was to be inventoried) and stakeholders to be considered as part of the organization’s footprint (i.e. defining which sets of peoples/groups/functions are to be included within the footprint boundary).
Scope:
Since Carbon Footprint Reporting for events in India is not mandated by either the Indian Government or the United Nations Framework Convention for Climate Change (UNFCCC), and CHAOS 2010’s initiative to address its Climate Change Impacts is purely voluntary, there was no set of pre-established guidelines for boundary definition to be followed. Thus, the globally accepted methodologies for National GHG Emissions Reporting (adopted by India as part of the Kyoto Protocol) laid down by the IPCC (Inter Governmental Panel on Climate Change) as part of the 2006 Guidelines were used for guidance wherever appropriate. However, given the unique nature of this event, the overall methodology reflected a confluence of standard protocols and event-appropriate approaches which provide an accurate estimate of the Climate Change impact of a unique cultural and live-entertainment event, which CHAOS represents.
Activity Boundaries:
Contributing Directly to Carbon Footprint: Cooking Fuel Consumption, Vehicular Fuel Consumption (these are activities where an individual or business has direct control over the amount of activity and the emission coefficient through technological choices)
Contributing Indirectly to Carbon Footprint (Primary Importance): Electricity Consumption, Water Consumption (these are activities where an individual or business has direct control over the amount of activity but not the emission coefficient through technological choices)
Contributing Indirectly to Carbon Footprint (Secondary Importance): Transportation (Rail, Road, and Air Travel), Food & Beverage comprising of Meat, Seafood, Dairy, Rice, Alcoholic and Bottled Water/Soft Drink Beverage Consumption, Waste Generation, Plastic, Paper and Other Consumables (these are activities where an individual or business can be considered to not have direct control over the amount of activity nor the emission coefficient through technological choices)
Stakeholder Boundaries:
CHAOS 2010 Organization
Event Performers
Event Participants
Life-cycle Boundaries:
Methodology
The research methodology followed for the project centered around the idea of dissecting the event operations and disaggregating the consumption of resources to understand the consumption patterns ‘ground-up’. While this approach was more time-consuming, as opposed to tracking all activities through a ‘centralized’ approach, it helped construct a detailed footprint-map that would be invaluable as an analysis tool to identify stakeholder contributions to overall footprint. This data was then refined and scrutinized for inaccuracies when data appeared to be erroneous.
Results
The total carbon footprint of CHAOS 2010 for the activities and stakeholders presented previously is estimated to be 29.7 tons of CO2e.
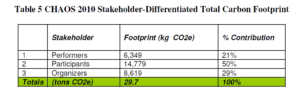
Table 4 presents the contributions to the total carbon footprint differentiated by scope. Items identified as ‘not known’ represent data that was unavailable for analysis due to constraints encountered by data gathering personnel, and underlined quantities represent activities where consumption was estimated based on an assumed per-participant consumption quantity.
Figure 7 displays the percentage of overall GHG emissions per activity. Auto-rickshaw and flights were the two largest contributors at 29% and 21%, respectively.
Table 5 displays the GHG emissions per stakeholder. The participants, at 50%, were by far the largest contributors.
Figure 2 displays the same results in a pie chart.
Conclusions
Preemptively, Participant Travel and Waste Generation Footprints may be mitigated in future events through:
provision of mass-transit based systems, such as fuel-efficient or alternative fuel (CNG) buses, to transport participants from pre-determined nodal locations in the surrounding areas of IIM(A) to the event.
waste management principles centered around waste segregation, organic waste composting, and waste recycling must be adopted in conjunction with the rigorous participant awareness effort to ensure minimal waste is sent to landfills as an outcome of CHAOS.
Finally, based on the above analysis presented earlier, it is recommended that IIM(A) offset a significant percentage of the footprint of CHAOS 2010 (29.7 tons of CO2e) through ‘domestic’ action. It is recommended that IIM(A) review its monthly electricity consumption and set a achievable ‘percentage-reduction’ target for the first quarter during the new Academic Year beginning in mid-2010 to ‘offset’ at least 50% of the 19,192 units (i.e. 10,000 units).
Although it has been around for a couple of decades, the life cycle assessment (LCA) is a tool increasingly being used by businesses to measure the environmental impact of their operations, products, and decisions. The LCA is defined by the USEPA as “a ‘cradle-to-grave’ approach for assessing industrial systems…[that] evaluates all stages of a product’s life from the perspective that they are interdependent, meaning that one operation leads to the next.” In recent years, LCAs have been performed at the organizational level, but typically they are used for individual products and decisions. An LCA measures everything that goes into a product from its creation to its disposal, all of the inputs and processes used every step of the way from the manufacturing of the parts used in its assembly to the chemicals added in its production to the electricity consumed during its use. (Of course such measurements could continue infinitely, so the LCA practitioner defines the boundaries during the first stage of the LCA.) LCAs are sometimes used to evaluate the outcomes of two different choices in a product’s design, e.g. using cotton that is either knit or woven in manufacturing a T-shirt, and can be extremely useful for businesses or individuals who seek to minimize their ecological footprint.
Here cBalance used the LCA to compare the environmental impacts of different food products manufactured by Gits Food, a business established in 1963 that pioneered convenience processed food in India and was one of the first food product manufacturing companies in India to have obtained ISO 9001 – 2008 (Quality Standard) and ISO 22000 (Food safety). Already a leader in terms of quality and credentials, they are looking to incorporate the principles of sustainability into their operations. ‘Gulab Jamun’, ‘Khaman Dhokla’, ‘Idli,’ and ‘Dosai’ were the products chosen for this study, and the LCA only analyzed GHG emissions.
Scope:
The scope of the study included the following life cycle stages of the products’ lives:
-Production
-Supply chain
-Upstream transport and distribution
-Waste
-Travel and commute
-Downstream logistics
-Use of sold products
-End of life treatment
Hotspot Analysis:
The stage with far and away the greatest impact is the raw material acquisition stage, contributing, on average, 63% of total GHG emissions. In line with the Greenhouse Gas Protocol classification, this stage also includes emissions from delivery of raw materials from suppliers and marine and road distribution for export, while ‘distribution and storage’ comprises road shipment from warehouses to retail outlets. Since raw materials have the biggest impact, efforts to reduce GHG emissions should focus on this area. The production stage contributed, on average, to 10% of the total GHG emissions, distribution and storage 0.7%, use of product 22.8%, end-of-life treatment 2.5%, and office footprint 0.5%. The average GHG emissions per packet of product was 648 grams, and the average GHG emissions per kilo of product was 2.53 kilograms.
Subsequent proposed steps:
-Internal training workshop to engage employees and the suppliers on issues related to sustainability and reduction of ecological footprint through sustainable operations and food sourcing practices
-Engage in smart consumer communication on the study, conveying on what can be done individually at home to reduce the footprint
-Industry-wide events to promote environmental awareness from food suppliers to manufacturers
Products’ Greenhouse Gas emissions:
Emissions per packet of product in grams of CO2e:
-594 Gulab Jamun
-620 Khaman Dhokl
-687 Dosai
-692 Idli
Solutions:
There are many ways that food companies can reduce their carbon (and overall ecological) footprint. Here are some recommendations:
-Switch to renewable energy supply
-Collaborate with milk farmers to implement energy efficiency measures at their farms
-Encourage consumers to use efficient cooking practices
-Switch to bio-derived fuel additives in vehicles
-Increase use of fuel-efficient vehicles
-The potential for reduction of greenhouse gas emissions across the four products is 2000 metric tons!
Conclusion:
Businesses can leverage product LCA outcomes in a number of ways. Most obviously, businesses can use these studies to reduce their carbon (and ecological) footprints through internal operational practices, collaboration with suppliers, and communication to customers. These studies can also be used to acknowledge a business’s eco-credentials through ecolabel certification schemes. And businesses can spread these messages across the industry through stakeholder events and workshops. Finally, under best-case circumstances, LCA data can be used to benchmark performance against other products domestically and internationally, providing customers with objective data on the environmental performance of the products they’re considering purchasing. LCAs can be extremely useful tools for organizations and individuals to reduce their environmental impacts, and hopefully they continue to become more widespread.
SAI Life Sciences: An overview of the Energy Audit
Established in 1999, and utilizing its core group of experts, SAI Life Sciences has been identified to be one of the pioneers in drug manufacturing, development and discovery, solely for Pharma innovators. cBalance Solutions Pvt. Ltd (India) was contacted by them to conduct a complete thermal and electrical energy audit, which was carried over a period of 10-days from the 19th of January 2015 to the 28th of January 2015, in Karnataka.
SAI Life was aiming to achieve the objectives of a ‘green industry’ by conserving their natural resources and reducing their environmental impact from the various operations undertaken by them. In order to achieve this, the energy and related cost conservation potential based on technological interventions, architectural interventions and operational process changes needed to be determined. A comparative analysis of the financial feasibility of the proposed alternatives on a life cycle cost basis, needed establishing. All of the above, along with determining the greenhouse gas (GHG) mitigation potential, in order to reduce SAI Life Sciences’ carbon footprint was undertaken by cBalance Solutions Pvt. Ltd.
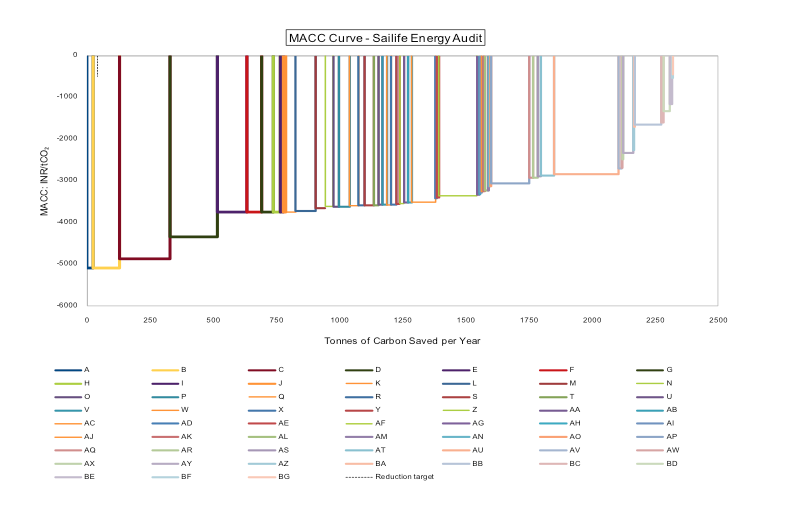
The above curve is identified to be a Marginal Abatement Cost Curve (MACC) for GHG emissions, which is often used as an important component of an institutionalized Sustainability Strategy. It helps in identifying the most cost-effective means of mitigating climate change impact, through several technological interventions and modifications in management practices. The MACC Curve helps in improving the planning of capital expenditure on Energy Efficiency, Water Conservation, Waste Reduction and Management projects, among many others, in a financially sustainable manner, while attaining the desired environmental and socio-economic sustainability benefits. Accumulating the economic benefits from the no-regret options and then stepping into the more challenging interventions is how this is generally done, thereby reducing the financial risk and ensuring longevity of the environmental program on the whole. The costs and benefits are calculated on the basis of real values of the financial parameters and resource conservation benefits of options reflecting the enhancement in technological alternatives.
When calculated for SAI Life, the analysis included the Baseline Performance Management (different power consumption patterns), Compressed Air System, Thermo-pack System, HVAC-Refrigeration System (cooling systems), Boilers and Steam System and other loads (including UPS, Scrubbers and Vacuum ejection system).
After this in-depth analysis it was found that the total current annual electrical energy consumption was approximately 57.6 Lakh kWh/year. In addition to electricity, the Plant was identified to consume 3045 metric tonnes of Coal and Biomass Briquettes for thermal energy and 102,251 liters of diesel annually for power generation. It was also identified that the electricity related emissions were considered to be the most significant supplier to the energy related GHG emissions, contributing 61% of the total emissions. Thus, a method allowing for the mitigation of electricity consumption, in order to prevent climate change on a large scale was suggested to be of a higher priority in comparison to the thermal energy conservation. The HVAC-Refrigeration system was identified to be one of the most critical components of energy consumption, thereby accounting for approximately 33.6% of the total load, followed by the Compressor and Cooling Tower Load. These three sources were identified to cumulatively contribute to approximately 84% of the total energy demand of the plant.
Here is the “MACC for GHG emissions” in table form. We recommend project A to be implemented by SAI Life management first as it offers the highest GHG emission reduction with significant annual savings and low capital cost. Project A is followed by a prioritized list of projects based on these criteria.
Pr. ID
System
Project Description
Capital Cost (INR)
Annual Savings (INR)
Payback Period (yrs)
MAC (Carbon Not Discounted)
A
Boiler System
Reduce Steam Leakage Loss
0
7,24,994
0.00
-5084.88
B
Boiler System
Improve Condensate Recovery to 40%
0
1,41,369
0.00
-5084.88
C
Boiler System
Boiler Radiation Loss Reduction
2,31,951
6,57,963
0.35
-4863.87
D
Boiler System
Flue Gas Waste Heat Recovery
15,00,000
12,65,122
1.19
-4341.57
E
Compressed Air System
Harnessing the leakage in Nitrogen Distribution Line
0
8,63,802
0.00
-3744.47
F
Compressed Air System
Proper Maintenance of Air Compressor Block 06
0
5,42,321
0.00
-3744.47
G
Compressed Air System
Proper Maintenance of Nitrogen Air Compressor up to the Air Receiver Tank
0
2,62,490
0.00
-3744.47
H
Compressed Air System
Proper Maintenance of Air Compressor Block 01
0
2,22,807
0.00
-3744.47
Project A: Steam Leakage
Capital Cost: INR 2,31,591, Annual Savings: INR 7,24,994 , Payback period: 0 years, MAC (Carbon not discounted) : -5084.88
Steam Leakage across the Plant was investigated through visual observation and complimented with the use of a Thermal Imaging Camera. Various locations were identified, wherein active steam was found leaking and four spots were identified as steam leakage hotspots upon which the steal leakage reduction strategy should be focused. It is recommended that regular surveillance and an adequate maintenance program is made for the identification of leaks on pipelines, flanges and joints. Once identified, prompt mitigation strategies should be undertaken in order to harness the low-hanging-fruit energy saving opportunity.
Project B: Condensate Recovery
Capital Cost: 0, Annual Savings: INR 1,41,369, Payback period: 0 years, MAC (Carbon not discounted) : -4863.87
Condensate Recovery from the Steam Distribution System was found to be startlingly low, with only 1,000 liters out of 25,000 TPD being recovered as condensate. This implies an exceptionally low rate of recovery (4%) further implying the rest of the condensate to be drained. Based on observations and experiential learning, it is understood that aiming to achieve a 40% condensate recovery would help in yielding an annual energy savings of approximately 330 GJ per year, eventually saving INR 1.41 Lakhs per year.
Project C: Boiler Radiation Loss Reduction
Capital Cost: 0, Annual Savings: INR 6,47,963 , Payback period: 0.35 years, MAC (Carbon not discounted) : -5084.88
In order to prevent the radiation loss, primary fuel saving opportunities available to the plant include the installation of a solar thermal system, for Boiler Feed Water pre-heating, which is identified to reduce the annual fossil fuel consumption by about 37.7%. A Waste Heat Recovery system could also be installed in order to harness the available energy, reducing the fossil fuel consumption by approximately 30%. Using these technologies would help reducing the annual electricity consumption by 4.2%, yielding energy cost savings of about 12.9% of the current annual energy bill.
The above three projects are examples of the different recommendations that are made in order to reduce the GHG emissions of SAI Life’s operational activities. Once these recommendations are put into place, SAI Life Sciences can achieve the following positive impacts on the environment and its operational costs:
Reduce Greenhouse Gas Emissions by 2,907 metric tonnes of CO2 per year (equivalent to planting approximately 11,628 trees every year)
Conserve 15.3 lakh units of electricity every year (enough to power 1,279 average Indian homes per year)
Reduce its operational cost by INR 1.42 Crore every year
The capital cost for implementing all the proposed projects is approximately INR 1.42 Crore
The payback period for these investments is a very feasible 1.24 years.
cBalance provided a detailed report, which included an in-depth assessment as a part of the energy audit and conservation strategy. The final project report can be found at http://cbalance.in/case-studies/ under the name of SAI Life Sciences.
This article is a simple “sustainability guide for the hospitality sector in India”. It will give an overview of the methods that can be taken by a hotel to chart a performance based sustainable growth path.
While a lot of hotels are taking positive measures to become environmentally friendly most of them are ad-hoc steps undertaken without any long term plan and data to substantiate the investment thus preventing hotels from being able to fully leverage their benefits. The main objective of these exercises is to be visible to the customers and project themselves as a green brand. This has led to “greenwashing” becoming a norm in the industry. Greenwashing can be defined as “The act of misleading consumers regarding the environmental practices of a company or the environmental benefits of a product or service”. The trap of greenwashing may enable firms to get short term returns on small investments but with a constant evolution of the knowledge base among customers, it compromises the integrity and the long term sustainability of the brand
Over time, green practices in the hospitality industry will become a baseline requirement, HCMI stands for Hotel Carbon Measurement initiative and is an effort to unite the hotel industry in order to calculate and communicate carbon emissions from guest rooms and meeting space in a uniform way. It is a simple method, available free of cost and a great starting point for any hotel looking to wet its toes on the path towards sustainability. It was developed by industry, for industry and will help customers especially corporate customers get accurate and consistent carbon footprint information from hotels globally. It is being pioneered by The International Tourism Partnership, World Travel & Tourism Council and 23 global hotel companies including well know ones such as Hyatt, Marriott, Hilton etc. It requires hotels to report emissions from only three key sectors which make up a bulk of the emissions namely: Fuel, Electricity and Outsourced Laundry. This will enable conscious individuals and companies to compare the basic sustainability of hotels globally and make informed decisions on how to spend their money; particularly as the cost of non-renewable energy continues to rise, regulatory pressure increases, and consumers become more demanding. Therefore, hotels with business models that revolve around green practices will have the strongest opportunity to achieve a competitive advantage by being ahead of the emerging sustainability curve. It would need hotels to move from a standard practice of proclaiming sustainability through words to a holistic approach that quantifies and certifies the operational performance of the hotel. As expected the international hospitality industry has taken the lead on this front. While doing so they have realized the benefits of these steps not only as a tool to better their image but one that also has a significant effect on their efficiency and as a result on their bottom line. This has resulted in the laggards in the industry having to pay dearly by spending large amounts of money to retrofit their hotels just to be competitive.
With the investment in India’s travel and tourism sector expected to grow at 8.8 % to INR 2,827.5 billion (US$ 63.7 billion) until 2021 there is a huge opportunity for hotels in India to learn from the industry around the world and invest early in a performance based system of sustainability that will help the hotel continuously improve its efficiency and performance.
The biggest challenge for the sector is that it is fragmented with the exception of a few big players. The smaller hotels are unable to visualize the larger impact of their activities. With limited knowledge and capability to invest in technological interventions it is absolutely necessary for them to accurately calculate the cost and resultant savings of various interventions so as to maximize their ROI. It is also equally important for these hotels to be able to accurately calculate and convey the savings and benefits to potential customers in a quantitative and qualitative manner to enable them to make informed decisions.
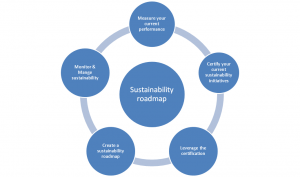
With a vision of enabling all: small & medium to large chain hotels across the country to undertake a wholesome approach to sustainability in a cost effective manner, outlined below is a realm of strategic steps that a hotel can take to put itself on the path to sustainable low carbon development.
Figure 1: The Sustainability roadmap
Measure your current performance: This is a process of defining the baseline for your hotel. It will help you see where you are currently placed and accordingly set goals. This does not require a hotel to have taken significant steps towards becoming sustainable. There are several frameworks that help you measure your baseline such as HCMI and The Green Signal Ecolabel.
green signal <Sustainability guide for the hospitality sector in India>
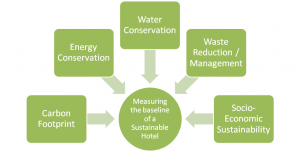
Hotels looking to get deeper into the realm of sustainability there is the Green Signal ecolabel which not only enables a hotel to measure its carbon footprint but also helps it measure sustainability parameters in energy conservation, water conservation, waste reduction and Social economic involvement. The method for measuring the carbon footprint of a hotel is also far more rigorous and includes parameters in Fuel, Electricity, Outsourced Laundry, Water, Waste Water, Corporate travel & F&B. This enables an organization to view its sustainability not only from the perspective of carbon but also from other key parameters like water and waste. Such a holistic study of a hotels sustainability enables it to prioritize areas of focus and set specific targets for improvement.
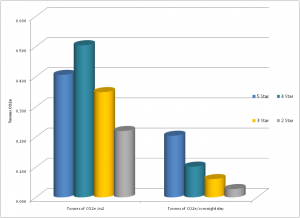
Certify your sustainability initiatives:. A common way of certification around the world has been in the form of ecolabels or other similar certifications from independent third parties. There exist in India quite a few certifications like LEED, GRIHA, IGBC etc for new development projects as well as a few international ecolabels especially for hotels. These standards are helpful to some extent but they fall short of providing a holistic solution to organizations as they are static, intent and compliance based rather than performance based. These methods advise you on what targets are to be achieved but do not help you select the appropriate interventions specifically for your project that will help you achieve those targets in a cost effective manner. A simple compliance system is not sufficient to accurately measure and convey the savings and the effect of the efficiency and conservation measures undertaken for the project to potential customers. The Green Signal Ecolabel while also providing a framework for sustainability measurement certifies applicants not only based on pre-specified targets but also on their relative performance to their peers in the sector. This is done by benchmarking the performance to specific peers who fall in the same sub groups such as hotel type, agro climatic zone and service grade. This encourages hotels to continually strive for improvement and keep pace with competitors, which improves the overall market stock. A survey conducted by BEE in partnership with USAID the results of which are shown below tells us that an average 5 star hotel can save between Rs.1-5 cr/year and abate between 500 to 5000 tonnes of CO2e/year depending on the agro climatic zone and size if it improves its energy efficiency to be in the Top 25% percentile.
Figure 3: co2 emissions of hotels by service grade
Figure 4: co2 emissions of hotels by service grade
Leverage the certification: After certification, hotels can take advantage of the credibility to reach out to current and potential customers and project themselves as a brand on the path towards sustainability. This includes branding all publicity collateral with the ecolabel, publishing a sustainability report, getting featured and listed on eco friendly travel portals frequented by conscious tourists. Hotels can also get innovative by initiatives such as conveying key performance data to guests in a non invasive manner at the appropriate point of contact such as ‘Our sensor taps save 3500l/year equivalent to 5% of our total water consumption shown in restrooms’, or using department specific data for staff training and internal goal setting. They can also go the extra mile and offer certified carbon neutral holidays to their guests.
Create a sustainability roadmap: Once a hotel has measured its baseline, taken some steps towards sustainability and gotten themselves certified they can opt for a in-depth analysis which will help them chart a short, medium and long term sustainability plan for their organization. Energy, Waste and Water audits can be carried out to assess resource intensive hot spots and deep opportunities for savings that can be harnessed by using eco-friendly alternatives for key products along with appropriate staff training. Innovative tools such as Marginal Green House Gases(GHG) Abatement Cost Curve (MACC) modelling can help prioritize green investments based on growth and investment patterns. MACC analysis is designed to discover the most cost-effective means of mitigating climate change impact by identifying the low-hanging fruit alternatives that must be pursued before embarking upon token or capital-intensive programs. MACC will help maximize tonnes of co2e abated for every Rs. spend and can be hotel or hotel chain specific or even community specific.
Monitor and manage sustainability: Once the opportunities have been identified and targets have been set a hotel will need to track its progress towards these goals. This can be done by empowering an individual or team within the organization to be the champions for change who will monitor and track progress. Cloud based carbon footprinting tools such as Footprint Reporter powered by an India specific emission factor database can also be effective methods to track sustainability projects and automatically generate statistics and reports which can help an organization effectively monitor its progress.
Each of these topics will be taken up in detail in the subsequent editions of this article.
In conclusion it is imperative for the hospitality industry to quickly realize that with increasing choice tourists are getting more discerning and environmentally conscious and are looking for brands with credible differentiators. Despite first-time guests basing their decisions on location, amenities and service, inclusive but non-intrusive sustainability initiatives have been shown to create positive perceptions in guests resulting in a higher recall rate. This results in increased customer loyalty as well as higher brand value of the hotel. To keep attracting tourists especially foreign tourists whose numbers are growing at 7.2% CAGR, hotels need to tap into new customer bases and create differentiators for themselves. Developing a short term and long term performance based sustainability strategy will enable an organization to identify a proactive low-carbon development pathway to be future ready.
For comments or feedback contact me on: udit@cbalance.in ( www.cbalance.in)


")

")

")

, Beer Bottle: Total avoided emission (per piece of beer bottle)")
")


 The following graph displays the coal savings, GHG intensity reduction, and COP15 commitment opportunities of the steel sector for the same years.
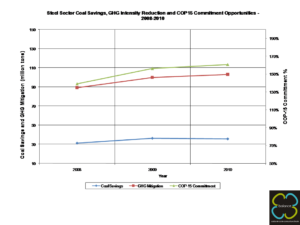


")