We continue our blog with another post on the hotel industry, this time discussing Mumbai’s 5 star hotel Meluha the Fern, which commissioned cBalance to provide an analysis of its ecological footprint and consumption for the years of 2011-12. Meluha the Fern is a business hotel located in a hot and humid climatic zone (see our last blog post for more information on the different climatic zones) with 141 rooms. Laundry and waste water treatment (aerobic) is off-site, and the average room tafiff is Rs. 6400.
Greenhouse Gas Inventory:
As is evident from the graph, the vast majority of emissions come from electricity generation (84.45%). Laundry is the second largest source (3.88%), followed by PNG (3.48%, dairy (2.49%, and meat (2.27%).
The total footprint of the hotel was 4224.47 tCO2e, with 0.12 tCO2e per overnight stay, 0.34 tC02e per square meter, and 29.9 tCO2e per room per year.
Compared to its peers, Meluha the Fern is in the top 2 percentile for overall energy efficiency, top 4 percentile for hotels in the Hot & Humid climatic zone, top 9 percentile for all 5 star hotels, and top 2 percentile for all business hotels.
Results:
The total CO2e for the reporting period was 1263 tCO2e, with 919.34 tCO2e from guestrooms and 343.23 tCO2e from meetings. The carbon footprint per occupied room on a daily basis was 27.2 kgCO2e and 94.0 kgCO2e per area of meeting space.
The carbon footprint of fuel usage overwhelmingly came from PNG (69%), followed by LPG (18%) and diesel (13%). The cost was even more lopsided, with 96% from PNG and 2% each from LPG and diesel.
Carbon emissions was not the only performance indicator we analyzed, however; water consumption was also evaluated. 29069 kiloliters of water was used by Meluha the Fern (resulting in associated emissions of 16.1 tCO2e). Most of it came by tanker (56%), and domestic water (48%), flushing (25%), and the cooling towers (23%) were responsible for nearly all of its use.
cBalance also analyzed Meluha the Fern’s food waste, which totaled at 112.78 tonnes (resulting in 2.9 tCO2e emissions), 90% of which went to the piggeries, with the remaining 10% being composted.
Laundry is another significant contributor to Meluha the Fern’s ecological footprint. There were 639.96 tons of laundry with an associated emissions of 163.83 tCO2e (260 kgCO2e per ton). The tent card, however, helped save 2% of laundry, meaning 1460 kWh of electricity, 480 KL of water, 700 I of furnace oil, and 4.4 tCO2e GHG emissions per year.
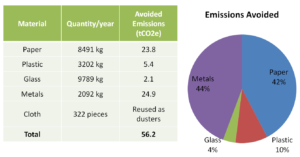
The following table and graph illustrate Meluha the Fern’s solid waste management:
Most of the avoided emissions were from metals (44% and paper 42%).
Meluha the Fern has also achieved large savings from its water practices. The campus area is 1046 square meters, while the rainwater capture area is 3130.55 square meters. 7% of capture rainwater is reused (360 KL per year), and 93% of captured rainwater is recharged into the ground (4782 KL per year).
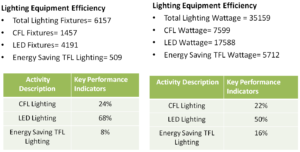
Energy savings result from Meluha the Fern’s choices of lighting equipment, as is shown by the following data:
Meluha the Fern also uses more sustainable forms of indoor cooling, with 10 split AC units (16 tonnes) and 50% of tonnage rated as 3 star equipment or above.
There are other areas as well where Meluha the Fern is able to save energy. 24% of the total pumping capacity comes from VFD pumps. Measures are taken to reduce refrigeration, 6% of the BUA is naturally lit, all of the windows are double-glazed, and all of the water pipes are insulated. 29% of the BUA is covered by BMS (building management systems), and the occupancy controlled area is 49% of the low traffic BUA area.
Some other notable sustainability measures included induction stoves for buffet counters, three self-cooking centers from Rational, a four bin method of trash segregation (at the source), no straws, paper napkins, or coasters, and glass bottles provided for water rather than bottled water (which aren’t filled unless asked for). Lastly, email usage is mandated and recycled paper is used for all stationary.
Other positives were that the data collection in housekeeping and engineering departments was excellent, and all staff members were very knowledgeable about sustainability initiatives within their departments.
Areas for improvement:
There were no sustainability initiatives involving guests, and the percentage of social development activities was very less (less than 1% of total man hours). There were not any norms for the use of organic food, either.
We continue our weekly blog with another post on hospitality, this time, an analysis of the hotel industry in general in India. In 2011, USAID and the Indian government’s Bureau of Energy Efficiency (BEE) commissioned a study by cBalance to understand the energy consumption of hotels in India, analyzing their carbon emissions, energy intensity, and efficiency and mitigation opportunities. The project’s goal, specifically, was to collect energy data for a robust set of hotels and hospitals distributed across all known climatic zones and recognized service-class categories in India to provide adequate data for the development of a statistical benchmarking system for buildings within service class categories of the above sectors based on their normalized energy performance index.
Project Scope:
Data set
Energy data collection was based on the following data groups:
Group 1: Business metrics
Service class type and size / service capacity
Area – Campus area, Built-up area, Carpet area, Common area, other use areas – conference area, restaurants etc.
Overnight occupancy (customers, patients)
Total occupancy
Employee strength
Group 2: Energy use
Purchased electricity
Captive power generation and associated fuel consumption
Fuel consumption for steam/water heating
Fuel consumption for cooking/catering
Other fuel consumption
Air Conditioning – installed capacity under all AC technology types
Lighting Load – installed capacity under all lighting technology types
Water pumping load – installed capacity under all lighting technology types
Other plug loads – Equipment, computers etc.
Sub-metered electricity consumption for AC, lighting, water pumping, plug load equipment, office equipment, electric geysers, kitchen equipment, laundry equipment, swimming pool, elevators, ETP/STP.
Renewable energy generation – solar PV, solar thermal water heating, waste to energy etc.
Water and Hot Water consumption.
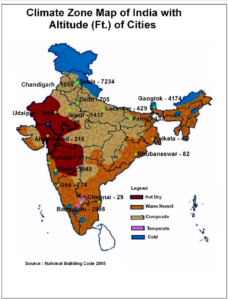
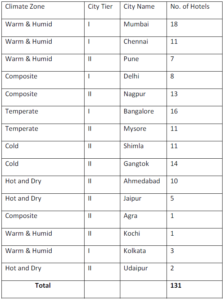
For this project, 131 hotels across the country in various cities and climatic zones and of various services grades were surveyed . The results are displayed in the following table and map:
More hotels lie in the warm and humid zone than any other (40), followed by composite (38), temperate (27), cold (25), and hot and dry (17):
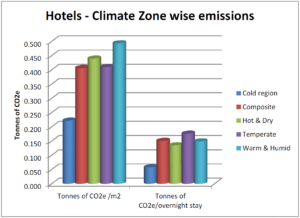
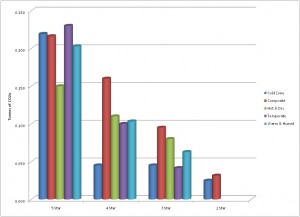
Energy consumption can vary significantly with respect to geographic location, and the following graph displays the results of our data collection:
Warm & humid regions consume the most amount of energy per square meter. This is because the high humidity reduces the performance of HVAC systems, requiring more energy to be consumed for cooling. Cold regions, on the other hand, have the lowest emissions because their air conditioning requirements are lower. This illustrates how significant air conditioning is as a portion of a hotel’s total energy consumption.
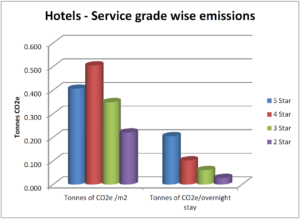
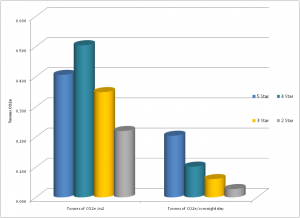
Energy efficiency also varies a great deal with respect to the service grade of the hotel, as is shown in the next graph:
It may seem counter-intuitive that 4 star hotels have higher emissions per square meter, but this is because they don’t use their space as efficiently as the five star hotels nor have invested in newer and greener technologies. Per overnight stay, 5 star hotels have the highest emissions due to the comfort and amenities they provide their customers with.
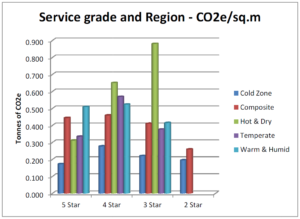
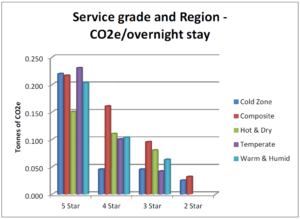
The following graphs break down the emissions of each service category per climatic zone. The data used below has also been normalized for whether the hotel does laundry in-house or outsources it, as this contributes a significant portion of the energy usage.
Potential for saving:
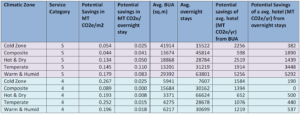
We calculated the amount of CO2e emissions that could be saved if all 5 star and 4 star hotels in each climatic zone improved their energy efficiency to that of the top 25% (75th percentile) of their peers:
As described in the above table, when measured from the built-up area (BUA), 5 star hotels can achieve a savings of 600 to 5000 tonnes of CO2e per year depending on the region, or 400-5000 tonnes of CO2e when calculating by overnight stay. For 4 star hotels, there is a potential savings of 650 to 1600 tonnes of CO2e and 190-530 tonnes when calculated by BUA and overnight stay, respectively. The largest potential for savings is in 5 stars hotels in warm and humid regions.
Further analysis of data, such as open and enclosed space use and technology interventions, has helped us document best practices in the industry and enabled us to create best practice guidelines for others to follow.
Climate Miles understands the unique requirements and challenges of the hotel industry to provide a high degree of comfort to their customers while keeping its footprint low. We work with clients across India through data driven methods to help them realize their carbon footprints relative to their peers with similar amenities. We also help them become more efficient through a wide array of process optimization and technology interventions with minimum disruption, which not only results in emission reduction but also increases bottom lines through cost savings. Our approach towards greening is to develop property specific or hotel chain specific MAC curves which will guide customers to prioritize their green investment opportunities.
MACC analysis is used for developing greening-roadmaps that transform the operations of institutions and corporations to set them on a low-carbon pathway. This is achieved by empowering them with information related to the ‘low-hanging fruit’ alternatives that must be pursued before embarking upon token or capital-intensive programs to reduce the Climate Change impacts of operational activities. The goal is to demonstrate the inherent alignment between economically prudent and environmentally imperative alternatives and debunk the myth that environmental responsibility reduces profits. If you would like your hotel to become more energy efficient or would like us to help you develop a energy efficiency or sustainability roadmap, please contact Vivek Gilani (Founder/Director of cBalance Solutions Hub) at vivek@cbalance.in
SAI Life Sciences: An overview of the Energy Audit
Established in 1999, and utilizing its core group of experts, SAI Life Sciences has been identified to be one of the pioneers in drug manufacturing, development and discovery, solely for Pharma innovators. cBalance Solutions Pvt. Ltd (India) was contacted by them to conduct a complete thermal and electrical energy audit, which was carried over a period of 10-days from the 19th of January 2015 to the 28th of January 2015, in Karnataka.
SAI Life was aiming to achieve the objectives of a ‘green industry’ by conserving their natural resources and reducing their environmental impact from the various operations undertaken by them. In order to achieve this, the energy and related cost conservation potential based on technological interventions, architectural interventions and operational process changes needed to be determined. A comparative analysis of the financial feasibility of the proposed alternatives on a life cycle cost basis, needed establishing. All of the above, along with determining the greenhouse gas (GHG) mitigation potential, in order to reduce SAI Life Sciences’ carbon footprint was undertaken by cBalance Solutions Pvt. Ltd.
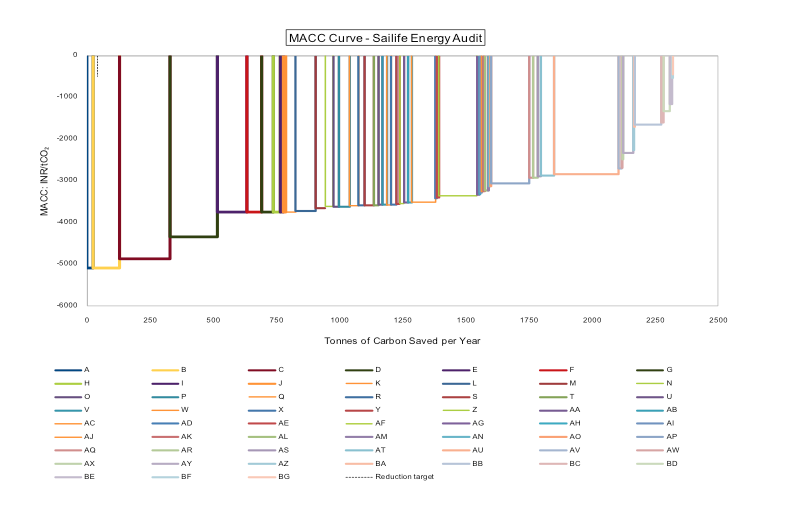
The above curve is identified to be a Marginal Abatement Cost Curve (MACC) for GHG emissions, which is often used as an important component of an institutionalized Sustainability Strategy. It helps in identifying the most cost-effective means of mitigating climate change impact, through several technological interventions and modifications in management practices. The MACC Curve helps in improving the planning of capital expenditure on Energy Efficiency, Water Conservation, Waste Reduction and Management projects, among many others, in a financially sustainable manner, while attaining the desired environmental and socio-economic sustainability benefits. Accumulating the economic benefits from the no-regret options and then stepping into the more challenging interventions is how this is generally done, thereby reducing the financial risk and ensuring longevity of the environmental program on the whole. The costs and benefits are calculated on the basis of real values of the financial parameters and resource conservation benefits of options reflecting the enhancement in technological alternatives.
When calculated for SAI Life, the analysis included the Baseline Performance Management (different power consumption patterns), Compressed Air System, Thermo-pack System, HVAC-Refrigeration System (cooling systems), Boilers and Steam System and other loads (including UPS, Scrubbers and Vacuum ejection system).
After this in-depth analysis it was found that the total current annual electrical energy consumption was approximately 57.6 Lakh kWh/year. In addition to electricity, the Plant was identified to consume 3045 metric tonnes of Coal and Biomass Briquettes for thermal energy and 102,251 liters of diesel annually for power generation. It was also identified that the electricity related emissions were considered to be the most significant supplier to the energy related GHG emissions, contributing 61% of the total emissions. Thus, a method allowing for the mitigation of electricity consumption, in order to prevent climate change on a large scale was suggested to be of a higher priority in comparison to the thermal energy conservation. The HVAC-Refrigeration system was identified to be one of the most critical components of energy consumption, thereby accounting for approximately 33.6% of the total load, followed by the Compressor and Cooling Tower Load. These three sources were identified to cumulatively contribute to approximately 84% of the total energy demand of the plant.
Here is the “MACC for GHG emissions” in table form. We recommend project A to be implemented by SAI Life management first as it offers the highest GHG emission reduction with significant annual savings and low capital cost. Project A is followed by a prioritized list of projects based on these criteria.
Pr. ID
System
Project Description
Capital Cost (INR)
Annual Savings (INR)
Payback Period (yrs)
MAC (Carbon Not Discounted)
A
Boiler System
Reduce Steam Leakage Loss
0
7,24,994
0.00
-5084.88
B
Boiler System
Improve Condensate Recovery to 40%
0
1,41,369
0.00
-5084.88
C
Boiler System
Boiler Radiation Loss Reduction
2,31,951
6,57,963
0.35
-4863.87
D
Boiler System
Flue Gas Waste Heat Recovery
15,00,000
12,65,122
1.19
-4341.57
E
Compressed Air System
Harnessing the leakage in Nitrogen Distribution Line
0
8,63,802
0.00
-3744.47
F
Compressed Air System
Proper Maintenance of Air Compressor Block 06
0
5,42,321
0.00
-3744.47
G
Compressed Air System
Proper Maintenance of Nitrogen Air Compressor up to the Air Receiver Tank
0
2,62,490
0.00
-3744.47
H
Compressed Air System
Proper Maintenance of Air Compressor Block 01
0
2,22,807
0.00
-3744.47
Project A: Steam Leakage
Capital Cost: INR 2,31,591, Annual Savings: INR 7,24,994 , Payback period: 0 years, MAC (Carbon not discounted) : -5084.88
Steam Leakage across the Plant was investigated through visual observation and complimented with the use of a Thermal Imaging Camera. Various locations were identified, wherein active steam was found leaking and four spots were identified as steam leakage hotspots upon which the steal leakage reduction strategy should be focused. It is recommended that regular surveillance and an adequate maintenance program is made for the identification of leaks on pipelines, flanges and joints. Once identified, prompt mitigation strategies should be undertaken in order to harness the low-hanging-fruit energy saving opportunity.
Project B: Condensate Recovery
Capital Cost: 0, Annual Savings: INR 1,41,369, Payback period: 0 years, MAC (Carbon not discounted) : -4863.87
Condensate Recovery from the Steam Distribution System was found to be startlingly low, with only 1,000 liters out of 25,000 TPD being recovered as condensate. This implies an exceptionally low rate of recovery (4%) further implying the rest of the condensate to be drained. Based on observations and experiential learning, it is understood that aiming to achieve a 40% condensate recovery would help in yielding an annual energy savings of approximately 330 GJ per year, eventually saving INR 1.41 Lakhs per year.
Project C: Boiler Radiation Loss Reduction
Capital Cost: 0, Annual Savings: INR 6,47,963 , Payback period: 0.35 years, MAC (Carbon not discounted) : -5084.88
In order to prevent the radiation loss, primary fuel saving opportunities available to the plant include the installation of a solar thermal system, for Boiler Feed Water pre-heating, which is identified to reduce the annual fossil fuel consumption by about 37.7%. A Waste Heat Recovery system could also be installed in order to harness the available energy, reducing the fossil fuel consumption by approximately 30%. Using these technologies would help reducing the annual electricity consumption by 4.2%, yielding energy cost savings of about 12.9% of the current annual energy bill.
The above three projects are examples of the different recommendations that are made in order to reduce the GHG emissions of SAI Life’s operational activities. Once these recommendations are put into place, SAI Life Sciences can achieve the following positive impacts on the environment and its operational costs:
Reduce Greenhouse Gas Emissions by 2,907 metric tonnes of CO2 per year (equivalent to planting approximately 11,628 trees every year)
Conserve 15.3 lakh units of electricity every year (enough to power 1,279 average Indian homes per year)
Reduce its operational cost by INR 1.42 Crore every year
The capital cost for implementing all the proposed projects is approximately INR 1.42 Crore
The payback period for these investments is a very feasible 1.24 years.
cBalance provided a detailed report, which included an in-depth assessment as a part of the energy audit and conservation strategy. The final project report can be found at http://cbalance.in/case-studies/ under the name of SAI Life Sciences.
This article is a simple “sustainability guide for the hospitality sector in India”. It will give an overview of the methods that can be taken by a hotel to chart a performance based sustainable growth path.
While a lot of hotels are taking positive measures to become environmentally friendly most of them are ad-hoc steps undertaken without any long term plan and data to substantiate the investment thus preventing hotels from being able to fully leverage their benefits. The main objective of these exercises is to be visible to the customers and project themselves as a green brand. This has led to “greenwashing” becoming a norm in the industry. Greenwashing can be defined as “The act of misleading consumers regarding the environmental practices of a company or the environmental benefits of a product or service”. The trap of greenwashing may enable firms to get short term returns on small investments but with a constant evolution of the knowledge base among customers, it compromises the integrity and the long term sustainability of the brand
Over time, green practices in the hospitality industry will become a baseline requirement, HCMI stands for Hotel Carbon Measurement initiative and is an effort to unite the hotel industry in order to calculate and communicate carbon emissions from guest rooms and meeting space in a uniform way. It is a simple method, available free of cost and a great starting point for any hotel looking to wet its toes on the path towards sustainability. It was developed by industry, for industry and will help customers especially corporate customers get accurate and consistent carbon footprint information from hotels globally. It is being pioneered by The International Tourism Partnership, World Travel & Tourism Council and 23 global hotel companies including well know ones such as Hyatt, Marriott, Hilton etc. It requires hotels to report emissions from only three key sectors which make up a bulk of the emissions namely: Fuel, Electricity and Outsourced Laundry. This will enable conscious individuals and companies to compare the basic sustainability of hotels globally and make informed decisions on how to spend their money; particularly as the cost of non-renewable energy continues to rise, regulatory pressure increases, and consumers become more demanding. Therefore, hotels with business models that revolve around green practices will have the strongest opportunity to achieve a competitive advantage by being ahead of the emerging sustainability curve. It would need hotels to move from a standard practice of proclaiming sustainability through words to a holistic approach that quantifies and certifies the operational performance of the hotel. As expected the international hospitality industry has taken the lead on this front. While doing so they have realized the benefits of these steps not only as a tool to better their image but one that also has a significant effect on their efficiency and as a result on their bottom line. This has resulted in the laggards in the industry having to pay dearly by spending large amounts of money to retrofit their hotels just to be competitive.
With the investment in India’s travel and tourism sector expected to grow at 8.8 % to INR 2,827.5 billion (US$ 63.7 billion) until 2021 there is a huge opportunity for hotels in India to learn from the industry around the world and invest early in a performance based system of sustainability that will help the hotel continuously improve its efficiency and performance.
The biggest challenge for the sector is that it is fragmented with the exception of a few big players. The smaller hotels are unable to visualize the larger impact of their activities. With limited knowledge and capability to invest in technological interventions it is absolutely necessary for them to accurately calculate the cost and resultant savings of various interventions so as to maximize their ROI. It is also equally important for these hotels to be able to accurately calculate and convey the savings and benefits to potential customers in a quantitative and qualitative manner to enable them to make informed decisions.
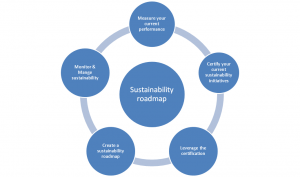
With a vision of enabling all: small & medium to large chain hotels across the country to undertake a wholesome approach to sustainability in a cost effective manner, outlined below is a realm of strategic steps that a hotel can take to put itself on the path to sustainable low carbon development.
Figure 1: The Sustainability roadmap
Measure your current performance: This is a process of defining the baseline for your hotel. It will help you see where you are currently placed and accordingly set goals. This does not require a hotel to have taken significant steps towards becoming sustainable. There are several frameworks that help you measure your baseline such as HCMI and The Green Signal Ecolabel.
green signal <Sustainability guide for the hospitality sector in India>
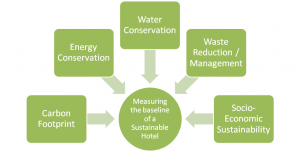
Hotels looking to get deeper into the realm of sustainability there is the Green Signal ecolabel which not only enables a hotel to measure its carbon footprint but also helps it measure sustainability parameters in energy conservation, water conservation, waste reduction and Social economic involvement. The method for measuring the carbon footprint of a hotel is also far more rigorous and includes parameters in Fuel, Electricity, Outsourced Laundry, Water, Waste Water, Corporate travel & F&B. This enables an organization to view its sustainability not only from the perspective of carbon but also from other key parameters like water and waste. Such a holistic study of a hotels sustainability enables it to prioritize areas of focus and set specific targets for improvement.
Certify your sustainability initiatives:. A common way of certification around the world has been in the form of ecolabels or other similar certifications from independent third parties. There exist in India quite a few certifications like LEED, GRIHA, IGBC etc for new development projects as well as a few international ecolabels especially for hotels. These standards are helpful to some extent but they fall short of providing a holistic solution to organizations as they are static, intent and compliance based rather than performance based. These methods advise you on what targets are to be achieved but do not help you select the appropriate interventions specifically for your project that will help you achieve those targets in a cost effective manner. A simple compliance system is not sufficient to accurately measure and convey the savings and the effect of the efficiency and conservation measures undertaken for the project to potential customers. The Green Signal Ecolabel while also providing a framework for sustainability measurement certifies applicants not only based on pre-specified targets but also on their relative performance to their peers in the sector. This is done by benchmarking the performance to specific peers who fall in the same sub groups such as hotel type, agro climatic zone and service grade. This encourages hotels to continually strive for improvement and keep pace with competitors, which improves the overall market stock. A survey conducted by BEE in partnership with USAID the results of which are shown below tells us that an average 5 star hotel can save between Rs.1-5 cr/year and abate between 500 to 5000 tonnes of CO2e/year depending on the agro climatic zone and size if it improves its energy efficiency to be in the Top 25% percentile.
Figure 3: co2 emissions of hotels by service grade
Figure 4: co2 emissions of hotels by service grade
Leverage the certification: After certification, hotels can take advantage of the credibility to reach out to current and potential customers and project themselves as a brand on the path towards sustainability. This includes branding all publicity collateral with the ecolabel, publishing a sustainability report, getting featured and listed on eco friendly travel portals frequented by conscious tourists. Hotels can also get innovative by initiatives such as conveying key performance data to guests in a non invasive manner at the appropriate point of contact such as ‘Our sensor taps save 3500l/year equivalent to 5% of our total water consumption shown in restrooms’, or using department specific data for staff training and internal goal setting. They can also go the extra mile and offer certified carbon neutral holidays to their guests.
Create a sustainability roadmap: Once a hotel has measured its baseline, taken some steps towards sustainability and gotten themselves certified they can opt for a in-depth analysis which will help them chart a short, medium and long term sustainability plan for their organization. Energy, Waste and Water audits can be carried out to assess resource intensive hot spots and deep opportunities for savings that can be harnessed by using eco-friendly alternatives for key products along with appropriate staff training. Innovative tools such as Marginal Green House Gases(GHG) Abatement Cost Curve (MACC) modelling can help prioritize green investments based on growth and investment patterns. MACC analysis is designed to discover the most cost-effective means of mitigating climate change impact by identifying the low-hanging fruit alternatives that must be pursued before embarking upon token or capital-intensive programs. MACC will help maximize tonnes of co2e abated for every Rs. spend and can be hotel or hotel chain specific or even community specific.
Monitor and manage sustainability: Once the opportunities have been identified and targets have been set a hotel will need to track its progress towards these goals. This can be done by empowering an individual or team within the organization to be the champions for change who will monitor and track progress. Cloud based carbon footprinting tools such as Footprint Reporter powered by an India specific emission factor database can also be effective methods to track sustainability projects and automatically generate statistics and reports which can help an organization effectively monitor its progress.
Each of these topics will be taken up in detail in the subsequent editions of this article.
In conclusion it is imperative for the hospitality industry to quickly realize that with increasing choice tourists are getting more discerning and environmentally conscious and are looking for brands with credible differentiators. Despite first-time guests basing their decisions on location, amenities and service, inclusive but non-intrusive sustainability initiatives have been shown to create positive perceptions in guests resulting in a higher recall rate. This results in increased customer loyalty as well as higher brand value of the hotel. To keep attracting tourists especially foreign tourists whose numbers are growing at 7.2% CAGR, hotels need to tap into new customer bases and create differentiators for themselves. Developing a short term and long term performance based sustainability strategy will enable an organization to identify a proactive low-carbon development pathway to be future ready.
For comments or feedback contact me on: udit@cbalance.in ( www.cbalance.in)