

Analysis of Consumption and Footprint of Meluha the Fern, an Ecotel Hotel
We continue our blog with another post on the hotel industry, this time discussing Mumbai’s 5 star hotel Meluha the Fern, which commissioned cBalance to provide an analysis of its ecological footprint and consumption for the years of 2011-12. Meluha the Fern is a business hotel located in a hot and humid climatic zone (see our last blog post for more information on the different climatic zones) with 141 rooms. Laundry and waste water treatment (aerobic) is off-site, and the average room tafiff is Rs. 6400.
Greenhouse Gas Inventory:
As is evident from the graph, the vast majority of emissions come from electricity generation (84.45%). Laundry is the second largest source (3.88%), followed by PNG (3.48%, dairy (2.49%, and meat (2.27%).

The total footprint of the hotel was 4224.47 tCO2e, with 0.12 tCO2e per overnight stay, 0.34 tC02e per square meter, and 29.9 tCO2e per room per year.

Compared to its peers, Meluha the Fern is in the top 2 percentile for overall energy efficiency, top 4 percentile for hotels in the Hot & Humid climatic zone, top 9 percentile for all 5 star hotels, and top 2 percentile for all business hotels.

Results:
The total CO2e for the reporting period was 1263 tCO2e, with 919.34 tCO2e from guestrooms and 343.23 tCO2e from meetings. The carbon footprint per occupied room on a daily basis was 27.2 kgCO2e and 94.0 kgCO2e per area of meeting space.
The carbon footprint of fuel usage overwhelmingly came from PNG (69%), followed by LPG (18%) and diesel (13%). The cost was even more lopsided, with 96% from PNG and 2% each from LPG and diesel.

Carbon emissions was not the only performance indicator we analyzed, however; water consumption was also evaluated. 29069 kiloliters of water was used by Meluha the Fern (resulting in associated emissions of 16.1 tCO2e). Most of it came by tanker (56%), and domestic water (48%), flushing (25%), and the cooling towers (23%) were responsible for nearly all of its use.
cBalance also analyzed Meluha the Fern’s food waste, which totaled at 112.78 tonnes (resulting in 2.9 tCO2e emissions), 90% of which went to the piggeries, with the remaining 10% being composted.

Laundry is another significant contributor to Meluha the Fern’s ecological footprint. There were 639.96 tons of laundry with an associated emissions of 163.83 tCO2e (260 kgCO2e per ton). The tent card, however, helped save 2% of laundry, meaning 1460 kWh of electricity, 480 KL of water, 700 I of furnace oil, and 4.4 tCO2e GHG emissions per year.
The following table and graph illustrate Meluha the Fern’s solid waste management:
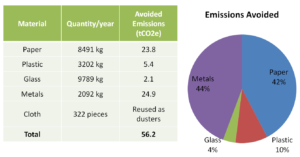
Most of the avoided emissions were from metals (44% and paper 42%).
Meluha the Fern has also achieved large savings from its water practices. The campus area is 1046 square meters, while the rainwater capture area is 3130.55 square meters. 7% of capture rainwater is reused (360 KL per year), and 93% of captured rainwater is recharged into the ground (4782 KL per year).
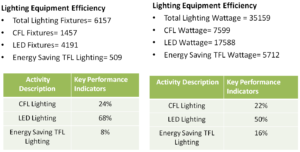
Energy savings result from Meluha the Fern’s choices of lighting equipment, as is shown by the following data:
Meluha the Fern also uses more sustainable forms of indoor cooling, with 10 split AC units (16 tonnes) and 50% of tonnage rated as 3 star equipment or above.
There are other areas as well where Meluha the Fern is able to save energy. 24% of the total pumping capacity comes from VFD pumps. Measures are taken to reduce refrigeration, 6% of the BUA is naturally lit, all of the windows are double-glazed, and all of the water pipes are insulated. 29% of the BUA is covered by BMS (building management systems), and the occupancy controlled area is 49% of the low traffic BUA area.
Some other notable sustainability measures included induction stoves for buffet counters, three self-cooking centers from Rational, a four bin method of trash segregation (at the source), no straws, paper napkins, or coasters, and glass bottles provided for water rather than bottled water (which aren’t filled unless asked for). Lastly, email usage is mandated and recycled paper is used for all stationary.
Other positives were that the data collection in housekeeping and engineering departments was excellent, and all staff members were very knowledgeable about sustainability initiatives within their departments.
Areas for improvement:
There were no sustainability initiatives involving guests, and the percentage of social development activities was very less (less than 1% of total man hours). There were not any norms for the use of organic food, either.
The original report can be read here:
Comments are closed