We continue our blog with another post on the hotel industry, this time discussing Mumbai’s 5 star hotel Meluha the Fern, which commissioned cBalance to provide an analysis of its ecological footprint and consumption for the years of 2011-12. Meluha the Fern is a business hotel located in a hot and humid climatic zone (see our last blog post for more information on the different climatic zones) with 141 rooms. Laundry and waste water treatment (aerobic) is off-site, and the average room tafiff is Rs. 6400.
Greenhouse Gas Inventory:
As is evident from the graph, the vast majority of emissions come from electricity generation (84.45%). Laundry is the second largest source (3.88%), followed by PNG (3.48%, dairy (2.49%, and meat (2.27%).
The total footprint of the hotel was 4224.47 tCO2e, with 0.12 tCO2e per overnight stay, 0.34 tC02e per square meter, and 29.9 tCO2e per room per year.
Compared to its peers, Meluha the Fern is in the top 2 percentile for overall energy efficiency, top 4 percentile for hotels in the Hot & Humid climatic zone, top 9 percentile for all 5 star hotels, and top 2 percentile for all business hotels.
Results:
The total CO2e for the reporting period was 1263 tCO2e, with 919.34 tCO2e from guestrooms and 343.23 tCO2e from meetings. The carbon footprint per occupied room on a daily basis was 27.2 kgCO2e and 94.0 kgCO2e per area of meeting space.
The carbon footprint of fuel usage overwhelmingly came from PNG (69%), followed by LPG (18%) and diesel (13%). The cost was even more lopsided, with 96% from PNG and 2% each from LPG and diesel.
Carbon emissions was not the only performance indicator we analyzed, however; water consumption was also evaluated. 29069 kiloliters of water was used by Meluha the Fern (resulting in associated emissions of 16.1 tCO2e). Most of it came by tanker (56%), and domestic water (48%), flushing (25%), and the cooling towers (23%) were responsible for nearly all of its use.
cBalance also analyzed Meluha the Fern’s food waste, which totaled at 112.78 tonnes (resulting in 2.9 tCO2e emissions), 90% of which went to the piggeries, with the remaining 10% being composted.
Laundry is another significant contributor to Meluha the Fern’s ecological footprint. There were 639.96 tons of laundry with an associated emissions of 163.83 tCO2e (260 kgCO2e per ton). The tent card, however, helped save 2% of laundry, meaning 1460 kWh of electricity, 480 KL of water, 700 I of furnace oil, and 4.4 tCO2e GHG emissions per year.
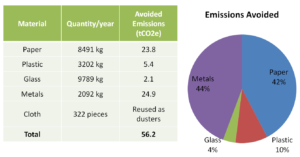
The following table and graph illustrate Meluha the Fern’s solid waste management:
Most of the avoided emissions were from metals (44% and paper 42%).
Meluha the Fern has also achieved large savings from its water practices. The campus area is 1046 square meters, while the rainwater capture area is 3130.55 square meters. 7% of capture rainwater is reused (360 KL per year), and 93% of captured rainwater is recharged into the ground (4782 KL per year).
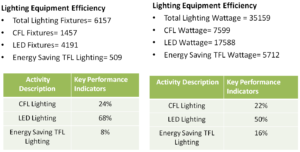
Energy savings result from Meluha the Fern’s choices of lighting equipment, as is shown by the following data:
Meluha the Fern also uses more sustainable forms of indoor cooling, with 10 split AC units (16 tonnes) and 50% of tonnage rated as 3 star equipment or above.
There are other areas as well where Meluha the Fern is able to save energy. 24% of the total pumping capacity comes from VFD pumps. Measures are taken to reduce refrigeration, 6% of the BUA is naturally lit, all of the windows are double-glazed, and all of the water pipes are insulated. 29% of the BUA is covered by BMS (building management systems), and the occupancy controlled area is 49% of the low traffic BUA area.
Some other notable sustainability measures included induction stoves for buffet counters, three self-cooking centers from Rational, a four bin method of trash segregation (at the source), no straws, paper napkins, or coasters, and glass bottles provided for water rather than bottled water (which aren’t filled unless asked for). Lastly, email usage is mandated and recycled paper is used for all stationary.
Other positives were that the data collection in housekeeping and engineering departments was excellent, and all staff members were very knowledgeable about sustainability initiatives within their departments.
Areas for improvement:
There were no sustainability initiatives involving guests, and the percentage of social development activities was very less (less than 1% of total man hours). There were not any norms for the use of organic food, either.
We continue our weekly blog with another post on hospitality, this time, an analysis of the hotel industry in general in India. In 2011, USAID and the Indian government’s Bureau of Energy Efficiency (BEE) commissioned a study by cBalance to understand the energy consumption of hotels in India, analyzing their carbon emissions, energy intensity, and efficiency and mitigation opportunities. The project’s goal, specifically, was to collect energy data for a robust set of hotels and hospitals distributed across all known climatic zones and recognized service-class categories in India to provide adequate data for the development of a statistical benchmarking system for buildings within service class categories of the above sectors based on their normalized energy performance index.
Project Scope:
Data set
Energy data collection was based on the following data groups:
Group 1: Business metrics
Service class type and size / service capacity
Area – Campus area, Built-up area, Carpet area, Common area, other use areas – conference area, restaurants etc.
Overnight occupancy (customers, patients)
Total occupancy
Employee strength
Group 2: Energy use
Purchased electricity
Captive power generation and associated fuel consumption
Fuel consumption for steam/water heating
Fuel consumption for cooking/catering
Other fuel consumption
Air Conditioning – installed capacity under all AC technology types
Lighting Load – installed capacity under all lighting technology types
Water pumping load – installed capacity under all lighting technology types
Other plug loads – Equipment, computers etc.
Sub-metered electricity consumption for AC, lighting, water pumping, plug load equipment, office equipment, electric geysers, kitchen equipment, laundry equipment, swimming pool, elevators, ETP/STP.
Renewable energy generation – solar PV, solar thermal water heating, waste to energy etc.
Water and Hot Water consumption.
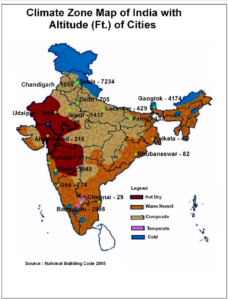
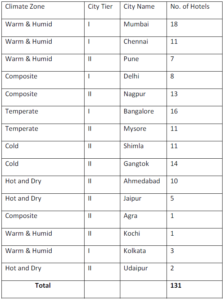
For this project, 131 hotels across the country in various cities and climatic zones and of various services grades were surveyed . The results are displayed in the following table and map:
More hotels lie in the warm and humid zone than any other (40), followed by composite (38), temperate (27), cold (25), and hot and dry (17):
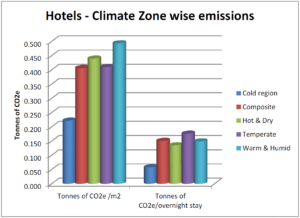
Energy consumption can vary significantly with respect to geographic location, and the following graph displays the results of our data collection:
Warm & humid regions consume the most amount of energy per square meter. This is because the high humidity reduces the performance of HVAC systems, requiring more energy to be consumed for cooling. Cold regions, on the other hand, have the lowest emissions because their air conditioning requirements are lower. This illustrates how significant air conditioning is as a portion of a hotel’s total energy consumption.
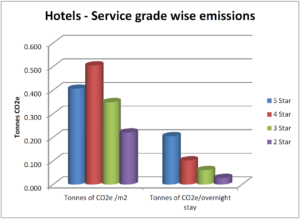
Energy efficiency also varies a great deal with respect to the service grade of the hotel, as is shown in the next graph:
It may seem counter-intuitive that 4 star hotels have higher emissions per square meter, but this is because they don’t use their space as efficiently as the five star hotels nor have invested in newer and greener technologies. Per overnight stay, 5 star hotels have the highest emissions due to the comfort and amenities they provide their customers with.
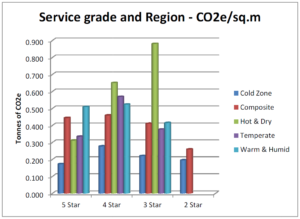
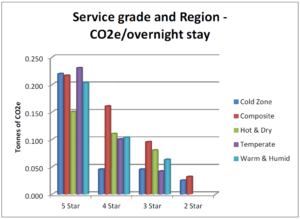
The following graphs break down the emissions of each service category per climatic zone. The data used below has also been normalized for whether the hotel does laundry in-house or outsources it, as this contributes a significant portion of the energy usage.
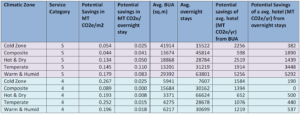
Potential for saving:
We calculated the amount of CO2e emissions that could be saved if all 5 star and 4 star hotels in each climatic zone improved their energy efficiency to that of the top 25% (75th percentile) of their peers:
As described in the above table, when measured from the built-up area (BUA), 5 star hotels can achieve a savings of 600 to 5000 tonnes of CO2e per year depending on the region, or 400-5000 tonnes of CO2e when calculating by overnight stay. For 4 star hotels, there is a potential savings of 650 to 1600 tonnes of CO2e and 190-530 tonnes when calculated by BUA and overnight stay, respectively. The largest potential for savings is in 5 stars hotels in warm and humid regions.
Further analysis of data, such as open and enclosed space use and technology interventions, has helped us document best practices in the industry and enabled us to create best practice guidelines for others to follow.
Climate Miles understands the unique requirements and challenges of the hotel industry to provide a high degree of comfort to their customers while keeping its footprint low. We work with clients across India through data driven methods to help them realize their carbon footprints relative to their peers with similar amenities. We also help them become more efficient through a wide array of process optimization and technology interventions with minimum disruption, which not only results in emission reduction but also increases bottom lines through cost savings. Our approach towards greening is to develop property specific or hotel chain specific MAC curves which will guide customers to prioritize their green investment opportunities.
MACC analysis is used for developing greening-roadmaps that transform the operations of institutions and corporations to set them on a low-carbon pathway. This is achieved by empowering them with information related to the ‘low-hanging fruit’ alternatives that must be pursued before embarking upon token or capital-intensive programs to reduce the Climate Change impacts of operational activities. The goal is to demonstrate the inherent alignment between economically prudent and environmentally imperative alternatives and debunk the myth that environmental responsibility reduces profits. If you would like your hotel to become more energy efficient or would like us to help you develop a energy efficiency or sustainability roadmap, please contact Vivek Gilani (Founder/Director of cBalance Solutions Hub) at vivek@cbalance.in
Schneider Electric Pvt. Ltd. commissioned cBalance to prepare a report showcasing the total carbon footprint of ‘Xperience Efficiency Yatra-2013,’ an event held across 44 cities that demonstrated how new energy technologies can change our lives and was attended by 11,792 customers and 3,422 Schneider Electric employees. The greenhouse gases (GHG) inventory was calculated using the sample data of 11 cities provided by Schneider Electric and generalizing for all 44 cities and accounted for the three major greenhouse gases: carbon dioxide (CO2), methane (CH4), and nitrous oxide (N2O). It was calculated according to the standards laid down in the GHG Protocol.
In the case of this report, the operational boundary for the GHG inventory was defined as:
Research Methodology
The research methodology consisted of the following steps:
Design questionnaire
Data collection
Data verification
GHG inventory calculations
Daya analysis
Reporting
Data
Data was obtained through a questionnaire designed by cBalance and collected by the Schneider Electric Marcom team at two levels: central and venue.
Central level data came from the back office of the Marcom team and included information such as hotel accommodations, communication materials, and air, rail, and bus travel of Schneider Electric employees, etc. It was available for all the 44 city events and the GHG emissions of these activities are, thus, calculated for all of them.
Venue level data was collected at the venues with the hotel staff as respondents. A universally applicable sample of 11 cities’ data was analyzed at the venue level.
cBalance used Footprint Reporter (FPR) to calculate GHG emissions, with the Footprint Report Emission Factor Database (EFDB) used as background data.
Electricity consumption:
Electricity consumption was calculated by using the number of hours the floor space of the venue was used for the event, with predefined electricity usage per square meter for 3 star, 4 star, and 5 star facilities being used for the analysis. It’s assumed that each session is 4.5 hours long (3 for assembly and 1.5 for disantling) and that events take place for 15 days in a month with an average of 8 hours per event.
Air travel:
Air travel activity data was calculated by estimating average passenger-km per flight (modeling that single flight by short, medium, and long haul type in FPR) and multiplying the footprint of each flight type by the total quantity of landings/take-offs (including stopovers), including circling-inefficiency (for domestic travel), per flight type. Short haul distances are defined to be between 0 to 694.5 km, Medium Haul distances defined as 995 to 1,620.5 km, and Long Haul distances are defined as 1,621 to 2,778 kms.
City travel and intercity travel of attendees:
The intercity travel of the attendees was considered to be 10% of the total attendees, with the other 90% traveling within the city. It was calculated for all modes of transport using the same data of city and intercity travel and was then estimated for the grand total attendees for all the events.
Accommodation:
Total overnight stay of employees of Schneider Electric in 3 star, 4 star, and 5 star facilities in different climatic zones (i.e. warm and humid, hot and dry, temperate) was computed and then modeled in FPR.
Food and Beverage:
It was assumed that every attendee consumed a liter of water at the event, and the emission per meal served was considered to be 0.855 kgCO2e.
Other activity data:
This included fuel consumption for diesel generator, heavy motor vehicles used in the logistics of the event, train and bus travel of Schneider Electric employees, and the total weight of recycled bags and brochures used.
Results
Scope 1, 2, 3 GHG Emissions:
As shown by the table and chart below, Scope 3 emissions were the largest contributor, at 57.8%, and Scope 1 emissions were the second largest, at 28.8%.
Scope 1 GHG emissions:
Heavy motorized vehicles used for event logistics were far and away the largest source of Scope 1 emissions, as is evident from the table and chart below.
Scope 2 emissions:
As demonstrated by the following table, all Scope 2 emissions are the consequence of electricity use. In terms of total magnitude, these emissions have a relatively low impact on the total GHG emissions as the events are not energy intensive and do not rely upon electrically powered machines or processes. These emissions consist of both- electricity purchased and AT&C losses.
Scope 3 emissions:
The table and chart below make it clear that accommodation was the largest source of Scope 3 emissions, followed by intercity travel.
Activity category-wise emissions:
Breaking down the emissions by activity gives us a different perspective from which to view the event’s carbon footprint. Accommodation was the single largest contributor to activity category-wise emissions, with 31.4 % of total GHG emissions, followed by logistics (24.0%). Intercity travel and purchased electricity consumption were also significant, at 15.7% and 13.4%, respectively. The rest were rather minor contributors.
Conclusion
This illustrates the total Carbon Footprint Summary of all the 44 city events as well as an average representing that for each city event. Total GHG emissions for all 44 city events amount to 388.384 Tonnes of CO2e, while GHG emissions per city event are 8.827 Tonnes of CO2e.
Wipro, an Indian IT services multinational company desiring to become greener, commissioned cBalance to calculate its carbon footprint from business air travel so that strategies could be implemented to reduce these emissions. Wipro has an international presence and a wide geographic base and, thus, must use air transport in order to meet the needs of its clients. In the 2013-14 financial year, Wipro reported 103 thousand tons of CO2e GHG emissions from business travel, which was 13% of its total! Here lied a great opportunity for Wipro to substantially reduce its carbon footprint. So we set out to:
• estimate the carbon emissions factors for domestic and international airlines used by Wipro in 2014-15
• estimate a GHG inventory of Wipro’s business air travel based on the GHG Protocol Corporate Accounting and Reporting Standard,
• make a rankings index of domestic and international airline carriers sorted by their GHG emissions factors,
• recommend a best-in-class air carrier for each sector of company air travel,
• model choices that could reduce GHG emissions (choosing the best airline, reducing the number of stops in a journey)
Not only would this be useful for Wipro, the results of the study could be potentially used by the public at large to reduce their own carbon footprints by simply by making the right decision at the time of booking a flight.
Methodology:
The scope of the project covered all airline business travel, international and domestic, of Wipro during the 2014-15 fiscal year: nearly 500,000 flight legs and about 1.3 billion passenger-km traveled. While about 60% of the flights were domestic, over three quarters of the distance traveled was from international flights.
The GHG emissions inventory was taken following the GHG Protocol’s Corporate Standard, which covers the accounting and reporting of the six greenhouse gases following the Kyoto Protocol: carbon dioxide (CO2), methane (CH4), nitrous oxide (N2O), hydrofluorocarbons (HFCs), perfluorocarbons (PFCs), and sulphur hexafluoride (SF6), and requires adherence to the principles of relevance, completeness, consistency, transparency, and accuracy. Only the first three greenhouse gases, carbon dioxide (CO2), methane (CH4), nitrous oxide (N2O), are considered, as emissions of the other three were below the materiality threshold as defined by the ‘completeness’ principle. Operational boundaries have been specified according to the standard, which entails categorizing emissions as either direct or indirect emissions and choosing the scope for indirect emissions. The measured unit of reference flow is passenger-km of air travel and the unit of analysis is Metric Tonne of CO2e.
Wipro provided the raw data set (flights, airport codes, and carrier codes) and collection began by devising and administering a list of data needs identified by the Standard. Domestic short-haul and long-haul flights were defined as shorter and longer than 500 km, respectively, and international short-haul flights as up to 2,000 km, medium-haul flights as between 2,000 and 5,000 km, and long-haul flights as greater than 5,000 km. cBalance corrected errors and invalid entries in these data.
To develop emission factors, LTO (landing/takeoff) and cruise mode emissions were calculated for all aircraft models. Next, best-case per-passenger emission factors for finite distances were derived for every aircraft model (using maximum passenger capacity and load factor of 1). The same was done for additional finite distances on every aircraft model. Then, the per-passenger emissions for finite distances for each airline was calculated by summing the LTO and cruise-mode emissions (accounting for weighted average airline passenger capacities, airline-wide passenger load factors, and passenger to freight ratios). Finally, the same was done for additional finite distances for each airline. Unfortunately, the relative frequency of operation or share of annual passenger-kms performed by a given aircraft model in an airline’s fleet could not be taken into consideration due to the unavailability of the necessary data regarding domestic airline operations. Incorporating such statistics to arrive at a weighted average would provide a more rigorous approach.
Scenario Modelling:
cBalance also modelled two different scenario comparisons. The first compared the baseline to the best-in-class and found that if international flights were switched to the best-in-class scenario, it would result in savings of 41% of GHG emissions. For all Wipro’s international flights, the total savings would be 70.44 thousand tonnes of CO2e emissions. For domestic US flights, the best-in-class scenario results in 37% savings (7.47 thousand tonnes), and for domestic Indian flights the savings are 20% (3.92 thousand tonnes). The second compared multi-stop to non-stop flights and found that for international flights, 25% savings resulted from using non-stop flights, and for US domestic flights, the savings were 50%.
Conclusions:
From the fourth quarter of the 2015-16 fiscal year to the first quarter of the next, Wipro reduced the number of segments flown by 8.7%, but GHG emissions decreased 30% cumulatively and 23% per segment. Wipro was able to achieve such huge emission reductions by merely flying 7% fewer multi-stop segments and choosing ‘cleaner’ airlines.
Based on these findings, cBalance recommends that if the difference between the two airlines is less than 15%, pick the non-stop flight on the ‘dirtier’ airline instead of a flight on a ‘cleaner’ airline with a layover. If the difference is greater than 15%, on the other hand, pick a flight on a ‘cleaner’ airline with a layover as opposed to a non-stop flight on a ‘dirtier’ airline.
Air travel is a highly unsustainable activity that should be avoided when possible. Companies are pledging to take advantage of the teleconferencing capabilities enabled by our age of high speed internet to avoid unnecessary face-to-face meetings. When it is impossible to avoid such flights, companies and individuals can choose the optimal airline, reduced number of stops, and economy class, to reduce their GHG emissions. Something as easy as picking a non-stop flight can save dozens of kilograms of CO2e emissions. For some perspective on what that means, a large tree breathes about 12 kilos of CO2 a year. This is an easy way to reduce one’s carbon footprint.