We continue our blog with another post on the hotel industry, this time discussing Mumbai’s 5 star hotel Meluha the Fern, which commissioned cBalance to provide an analysis of its ecological footprint and consumption for the years of 2011-12. Meluha the Fern is a business hotel located in a hot and humid climatic zone (see our last blog post for more information on the different climatic zones) with 141 rooms. Laundry and waste water treatment (aerobic) is off-site, and the average room tafiff is Rs. 6400.
Greenhouse Gas Inventory:
As is evident from the graph, the vast majority of emissions come from electricity generation (84.45%). Laundry is the second largest source (3.88%), followed by PNG (3.48%, dairy (2.49%, and meat (2.27%).
The total footprint of the hotel was 4224.47 tCO2e, with 0.12 tCO2e per overnight stay, 0.34 tC02e per square meter, and 29.9 tCO2e per room per year.
Compared to its peers, Meluha the Fern is in the top 2 percentile for overall energy efficiency, top 4 percentile for hotels in the Hot & Humid climatic zone, top 9 percentile for all 5 star hotels, and top 2 percentile for all business hotels.
Results:
The total CO2e for the reporting period was 1263 tCO2e, with 919.34 tCO2e from guestrooms and 343.23 tCO2e from meetings. The carbon footprint per occupied room on a daily basis was 27.2 kgCO2e and 94.0 kgCO2e per area of meeting space.
The carbon footprint of fuel usage overwhelmingly came from PNG (69%), followed by LPG (18%) and diesel (13%). The cost was even more lopsided, with 96% from PNG and 2% each from LPG and diesel.
Carbon emissions was not the only performance indicator we analyzed, however; water consumption was also evaluated. 29069 kiloliters of water was used by Meluha the Fern (resulting in associated emissions of 16.1 tCO2e). Most of it came by tanker (56%), and domestic water (48%), flushing (25%), and the cooling towers (23%) were responsible for nearly all of its use.
cBalance also analyzed Meluha the Fern’s food waste, which totaled at 112.78 tonnes (resulting in 2.9 tCO2e emissions), 90% of which went to the piggeries, with the remaining 10% being composted.
Laundry is another significant contributor to Meluha the Fern’s ecological footprint. There were 639.96 tons of laundry with an associated emissions of 163.83 tCO2e (260 kgCO2e per ton). The tent card, however, helped save 2% of laundry, meaning 1460 kWh of electricity, 480 KL of water, 700 I of furnace oil, and 4.4 tCO2e GHG emissions per year.
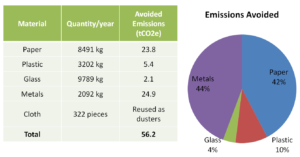
The following table and graph illustrate Meluha the Fern’s solid waste management:
Most of the avoided emissions were from metals (44% and paper 42%).
Meluha the Fern has also achieved large savings from its water practices. The campus area is 1046 square meters, while the rainwater capture area is 3130.55 square meters. 7% of capture rainwater is reused (360 KL per year), and 93% of captured rainwater is recharged into the ground (4782 KL per year).
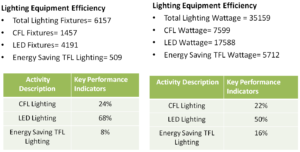
Energy savings result from Meluha the Fern’s choices of lighting equipment, as is shown by the following data:
Meluha the Fern also uses more sustainable forms of indoor cooling, with 10 split AC units (16 tonnes) and 50% of tonnage rated as 3 star equipment or above.
There are other areas as well where Meluha the Fern is able to save energy. 24% of the total pumping capacity comes from VFD pumps. Measures are taken to reduce refrigeration, 6% of the BUA is naturally lit, all of the windows are double-glazed, and all of the water pipes are insulated. 29% of the BUA is covered by BMS (building management systems), and the occupancy controlled area is 49% of the low traffic BUA area.
Some other notable sustainability measures included induction stoves for buffet counters, three self-cooking centers from Rational, a four bin method of trash segregation (at the source), no straws, paper napkins, or coasters, and glass bottles provided for water rather than bottled water (which aren’t filled unless asked for). Lastly, email usage is mandated and recycled paper is used for all stationary.
Other positives were that the data collection in housekeeping and engineering departments was excellent, and all staff members were very knowledgeable about sustainability initiatives within their departments.
Areas for improvement:
There were no sustainability initiatives involving guests, and the percentage of social development activities was very less (less than 1% of total man hours). There were not any norms for the use of organic food, either.
The Coconut Lagoon Heritage Resort in Kumarakom, Kottayam district, Kerala commissioned the Green Signal to provide it with an ecolabel rating, which was determined to be 4 bars out of 5.
The ecolabelling process is based on these three areas of investigation, verification, and documentation: GHG inventory assessment of the hotel (with respect to energy, water, waste, mobility, and materials), the conservation practices (of materials, waste, water, and energy) within the hotel, and the sustainability initiatives promoted/operated by the hotel.
Consolidated Activity Data and GHG Inventorying – FY 2011-12
Total annual GHG emissions: 1210.9 MT CO2e/year
Total annual overnight stays for FY 2011-2012 is 10,138, and the GHG emissions per overnight stay (all emission scopes) is 119 kg C02e/overnight stay:
Only taking into account Scope 1 and 2 emissions, the GHG emissions per stay are 106 kg CO2e/overnight stay, meaning that Coconut Lagoon has lower GHG emission than 87% of 5 star hotels in the Warm & Humid Agro-Climatic Zone.
Positive Environmental Impacts
Waste Reduction and Management
Waste Reduction:
-Paper reductions – newspapers aren’t delivered to each room; rather there’s common reading material provided in congregation areas. Reusable cloth bags are used as bin liners in guest rooms.
-Plastic reductions – Use of plastic packing for supplies coming onto the property by vendorsis prohibited (vendors are required to package material in reusable containers/jars). Bottled water suppliers are asked to take back empty PET bottles, and soap/shampoo containers are made from terracotta.
-Other – Organic paddy cultivates eliminates the use of fertilizer and pesticides and reduces water use.
Low Embodied Carbon/recycled materials:
-Recycled paper is used for all communication materials, guest amenities, and restaurant menus.
-The on-site school for the staff’s children is built from recycled PET bottles.
-90% of BUA is comped of re-assembled ‘Tharavad’ houses.
-All laundry detergent, soaps, and shampoos are biodegradable (so that wastewater treatment plants work properly). Organic pesticides are used rather than conventional ones.
Biodegradable/non-biodegradable waste:
-Cooking waste is processed by conversion into methane by a biogas plant.
-Dry leaves are composted in bamboo bins using slurry from from the biogas as a bio-catalyst, and the resulting compost is used for farming.
-Coconut husks and other organic materials not suitable for biogas processing are composted on-site and then used for farming.
-Non-biodegradable waste is segregated and sold to scrap dealers for recycling; near 100% recycling is achieved for the majority of waste categories.
-Paper waste is recycled for envelopes, and construction material refuse is used for the construction of walking pathways. Old cloth refuse and bed linen are donated to local orphanages.
Water related practices
-Wastewater is treated by a sewage treatment plant using Expanded Granular Sludge Bed Reactor (EGSBR) and filtration technology and the effluent is used for gardening purposes.
-Push-taps are installed in staff quarters and messes and guest bathrooms are equipped with dual-cistern flush systems reduce water consumption. Instead of a conventional lawn, an indigenous variety of Buffalo Grass is used that requires less water, curbs evaporation, and enhances groundwater recharge.
-Rainwater harvesting means that Coconut Lagoon’s operation during monsoon season is entirely water self-sufficient (additional water–2700 kilos–is sourced from tankers only during the summer months of March to June).
Energy related practices
Energy efficiency:
-Lighting is more efficient because CFL bulbs are used in the gardens, and LED and T5, T8 tubelight fixtures with electronic ballots are used elsewhere.
-HVAC – the use of 30 TR VRF systems account for 22% of the total tonnage, and 28 split-unit systems of 2.2 TR capacity have an EER greater than 2.92.
-Has naturally lit and naturally ventilated restaurants; all guest rooms and bathrooms are designed to maximize natural light and ventilation.
-Capacitor banks are installed to achieve power factor improvement; power saver technology is used in all 50 rooms.
Renewable Energy Practices
-A solar thermal network supplies the hot water requirement (13,000 liters per day) for 50 guest rooms and the kitchen.
-A 2kW Solar PV on one of the guest transport boats comprises 0.50% of total connected load.
-A biogas-run cooker, running on methane from the biogas plant with a calorific value equivalent to 17kgs of LPG a day, can cook 80 kgs of rice per day. Excess methane from the biogas plant and EGSB reactors not used for cooking purposes is used to power street lamps that would have a combined load of 500 watts under normal conditions.
Sustainability Practices
Food Procurement Practices
-59.47% of annual food procurement cost comes from within the state, and 0.46% annual food procurement is spent on organic food.
Economic, Social, and Environmental Development Practices
-80% of unskilled labor comes from the community, and cloth laundry bags, paper bags, envelopes from newspapers, and terracotta waste bins are all manufactured locally.
-Coconut Lagoon has adopted two local schools and financially supports their maintenance work, station, and study materials and resources.
-Waste bins are provided for the 180 families (1 per 10 families) in the village.
-Dry waste from community bins is collected weekly for recycling, and cloth bags are distributed in the local community every 3 months as part of a ‘Plastic Eradication Programme.’ CFL bulbs are distributed within the community as well for household use.
-Staff members lead monthly clean up drives and conduct periodic environmental education classes in adopted local schools (students also take field trips to study Coconut Lagoon’s green practices). Earth Hour awareness programs are also held within the local community, as are community tree plantation drives.
Engagement in Sustainable Tourism Initiatives
-Guests are encouraged to participate in biodiversity appreciation initiatives, and an in-house naturalist at the Interpretation Centre can educate them on the ecology of the region.
-Guests are also encourage to participate in the organic rice plantation and cultivation activities as well as the tree plantation initiatives in the surrounding area.
Biodiversity Preservation Initiatives
-Coconut Lagoon has a total of 1101 trees representing 90 different species on its property.
-It also has a butterfly garden with 17 different species and a fish sanctuary with 44 different species.
-Mangrove saplings have been planted along the waterside as an effort to restore rapidly disappearing mangroves as well as spread awareness about their importance to the community.
This report presents state wise emission factors for electricity generation as well as their respective AT&C losses. To enable accurate calculation of emissions by end users in each state the two factors are also combined to present an emission factor for end user consumption of electricity in each state in India. This report, brought out by cBalance Solution Pvt. Ltd., also highlights comparative emissions of all states taking into account each ones specific emission factor which with further analysis can be used as a tool for progressive national policy making in order to help India achieve its goal of 20-25% emissions reduction from 2005 levels by 2020.
1.1 STATE OF THE POWER SECTOR IN INDIA (2009-10)
Though the total ex-bus energy availability increased by 8.0% over the previous year and the peak met increased by 7.5%, there were still significant shortages in the country both in terms of both energy and peaking availability as given below:
Energy (MU)
Peak (MW)
Requirement
8,30,594
1,19,166
Availability
7,46,644
1,04,009
Shortage
83,950
15,157
% shortage of requirement
10.10%
12.70%
The energy requirement registered a growth of 6.9% during the year against the projected growth of 8.2% and Peak demand registered a growth of 8.5% against the projected growth of 8.2%.
1.2 State wise contribution in electricity generation and consumption
About 50% of states & union territories are not self sufficient in electricity generation and are dependent on others states to fulfill their requirements.
Maharashtra is highest generator and consumer of electricity with Gujarat, Andhra Pradesh and Tamil Nadu close behind. Chattisgarh exports the largest amount of electricity at 4941 GWh while Tamil Nadu imports 4046 GWh which is the highest in the country.
2. Scope and Methodology
The data is sourced from CEA reports and calculations are done as outlined in the IPCC 2006 guidelines.
Electricity generation factor (kgCO2e/kWh)
(Emission from fossil fuels used for generation + Emission from electricity imported from other states – emission from electricity exported to other states) / Total electricity consumed by state
Fossil fuel electricity generation technologies include coal, thermal, Gas turbine generation and Diesel Generators.
Emissions from renewable energy technologies are considered to be zero.
AT&C Losses factor (kgCO2e/kWh)
(Total electricity generated by state x adjusted electricity generation factor of state x % of AT&C losses in the state)/ Total electricity consumed by state)
Adjusted generation emissions are Total electricity consumed * emission factor adjusted for import and export of electricity
The following results stand out from the above table:
Jharkhand has the highest emission factor for generation at 1.21 kgCO2e/kWh and also the highest emission factor after adjusting for import and export of electricity which is 1.33 kgCo2e/kWh
2. Bihar has the highest AT&C losses in the system due to which it has the highest emission factor for AT&C losses which is 0.86 kgCO2e/kWh. This also results in it having the highest emission factor for end user consumption of electricity at 2.1 kgCO2e/kWh.
3. The average India electricity generation emission factor is 0.89 kgCO2e/kWh and average India AT&C loss emission factor is 0.30 kgCO2e/kWh.
4. States that import electricity are liable for the corresponding proportion of emissions of each state from where electricity is imported. Hence some states like Sikkim, Assam, Manipur, Nagaland in particular appear to be “dirtier” i.e. their emission factors are quite high because they are importing electricity from states which have a high electricity generation emission factor.
3.2 State wise end user consumption emission factor of electricity
Graph 1: State wise end user electricity emission factor
In the above graph we can see almost 45% of states have an end user emission factor that is higher than the India avg. emission factor of electricity generation.
In many cases we can see that states have a low adjusted emission factor for generation but due to high AT&C losses their end user emission factor is higher than the India avg. emission factor. This point is illustrated in detail in the graph below.
3.3 State wise AT&C losses and emission factors for AT&C losses
Graph 2: State wise AT&C % losses and AT&C loss emission factors
As shown above the India average AT&C % loss is 25%. Also there is a big variation in the % losses between the grids specifically such as the South grid and NEWNE grid.
Highest AT&C % loss of 67% is recorded from Jammu & Kashmir and the lowest one recorded from D.&N. Haveli which is 11%.
About 40% states have higher AT&C system losses than the India average which points to a huge potential to save electricity with up gradation of technology and proper maintenance of transmission and distribution systems. It is also noticeable that states with difficult terrain such as hills and forests have higher AT&C losses than other states.
Another important fact visible in the graph above is that the AT&C loss emission factor is not only dependant on the quantum of losses but also on the source of electricity generation. Hence a state with low AT&C losses but “dirtier” sources of electricity generation could still have an AT&C emission factor higher than that of a state with higher losses but cleaner sources of generation. For e.g. Arunachal Pradesh has extremely high losses of about 47% but since most of its electricity is generated through hydel power its AT&C factor is less than 0.1 kgCO2e/kWh. Whereas Jharkhand has losses of only about 23% but its AT&C emission factor is about 0.3 kgCO2e/kWh since most of its electricity is generated from coal.
3.4 State wise contribution in electricity generation and emission from electricity generation
Graph 3: State wise % contribution in total electricity generation and % contribution in total emission from generation of electricity (all sources)
In the above graph we can see that a majority i.e. 23 states and UT’s contribute less than 1% each to India’s generation and emission stock. The majority generators are Maharashtra, & Gujarat and they are responsible for 9.2% and 6.8% of generation stock and 10.2% and 6.3% of emissions respectively.
Karnataka also has the lowest percentage of emissions of 2.9% with respect to it percentage of generation stock of 4.7% while Uttar Pradesh has the highest percentage of emissions of 4.3% over its percentage contribution to the generation stock at 3.3%.
4. Conclusion
A majority of emissions from the power sector are due to usage of coal as a primary medium for electricity generation (68%). There is a large potential to reduce emissions through usage of better quality of coal, more efficient technologies as well as moving to cleaner technologies such as thermal, hydro, solar etc. But these scenarios depend on various factors such as cost, geographical location, availability of raw materials etc and hence are hard to predict.
But as shown earlier, states with relatively clean generation technologies still have quite a poor end user emission factor due to major AT&C losses. This is a “low hanging fruit” opportunity for states to drastically improve their quality of electricity and emission factors. For e.g. if all states whose AT&C losses lie below the India avg. of 25% move up to atleast the average, an emission reduction of approximately 15 MTCO2e is possible. In the best case scenario if all states improve their efficiency of AT&C to the world average of 8.4% phenomenal savings of 115 MTCO2e are possible which is a reduction of about 67% of emissions due to AT&C losses. These steps can go a long way in helping India achieve its goal of 20-25% reduction in emissions over 2005 levels by 2020.
[1] Data Source : CEA – All India Electricity Statistics – General Review 2011
[2] Data Source : CEA – All India Electricity Statistics – General Review
2011
[3] Chandigarh is exporting more quantity than total generation so on the conservative principal assumed that one State whatever is importing within that it is consuming electricity embedded with higher emission.
Diu Electricity GHG EF (except AT&C Loss GHG EF) is same because it has been calculated on combined level due to non availability of quantity of exported and imported electricity.
[5] Sikkim is exporting more quantity than total generation so on the conservative principal assumed that one State whatever is importing within that it is consuming electricity embedded with higher emission.