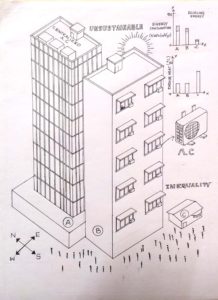
“What is ‘enough’ in construction and even in life in general? What are we looking at in terms of impact when we construct a massive glass building in the middle of tropical cities like Pune or Mumbai or Bangalore? Are we just constructing something that gives us a panoramic view of the city and serves no other function?Isn’t this similar to spending crores on making an oven and then spending crores more to refrigerate it?”
These are the questions Mr. Nilesh Vohra, a young builder of Kanchan Developers, Pune was asking himself after a conference on ‘Defaulting Green’ in Kerala a few years ago. Nilesh is part of theGreen Buildings Committee of the Pune chapter of a nationally recognised builders association in Indiaand met inspiring green building consultants and developers through this forum. These are his initial manoeuvres into responsible construction practices.
Nileshs’ questions draw attention to the need for constructing buildings that are not solely driven by social notions of a ‘premium’ building (in this case, glass buildings), but also consider the social, economic and environmental implications of designing such buildings, which when not considered are detrimental to society and the environment as a whole.
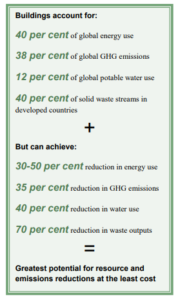
Why should the building economy consider moving towards green building construction, immediately? [footnote-(fn1)] In an era of human-induced climate crisis (fn2), we need to limit global warming to less than 1.5°C above pre-industrial levels, since estimates state that an increase in temperatures beyond 1.5°C will accelerate the climate crisis, resulting in increased unpredictable and uncontrollable occurrence of disasters such as floods, droughts, biodiversity loss, cyclones, etc. These episodes impact vulnerable sections of society in-equitably; not only are those from economically poorer backgrounds impacted first, but women, children, the elderly and sick are also vulnerable. Everyone, irrespective of who we are, will bear the consequences of climate collapse. The damage to buildings and other property, goes without saying, too. In order to avoid such damage, climate scientists caution towards reducing our greenhouse gas (GHG) emissions by 45% before 2030 and reaching net-zero emissions by 2075. The role of the building economy in contributing to GHG emissions and its potential to mitigate it are stated in the image (UNEP, 2012).
If constructing a ‘safe’ building is a non-negotiable value , considering the implications of the building economy on the environment, can green buildings be an option or are they a necessity?
According to India Brand Equity Foundation (2018), the number of Indians living in urban areas will increase from 434 million in 2015 to about 600 million by 2031, increasing the demand for residential and commercial buildings, both. Recognising the projected increase in construction activities, there seems to be ample opportunity to move towards responsible green building construction. Easy to say “Construct green buildings.” but how do we go about constructing these? What are the steps we have to take to implement these ideas in reality? How do we encourage and support the likes of Nilesh Vohra in making these a priority, amidst all the other logistical and bureaucratic challenges of building in these times? Based on our experience with carbon footprinting and ongoing dialogue with stakeholders contributing towards building construction, we offer some perspective that can facilitate the move forward.
Carbon Footprinting: A means towards responsible construction
What is carbon footprinting and how is it useful? Carbon footprinting is a measurable, verifiable and comparable instrument that entails measuring the carbon emissions during different operations and activities, in this case, building activities. This supports identifying alternatives to reduce emissions and where these would be most effective, thereby minimizing the negative impacts of construction on the environment. By quantifying carbon reduction efforts in building construction, meaningful and comparable information can be shared with building sector counterparts as well as potential buyers creating a base of evidence and commitment towards responsible construction. Carbon footprinting of building projects is a means for builders to begin demonstrating care for the larger world we belong to.
Just as one would not simply measure blood sugar levels of a diabetic without the intent to reduce them, responsible building, therefore, does not end with measuring the carbon footprint of a project. Incorporating actionable steps to mitigate emissions that are avoidable is the most important part.
The cBalance Carbon Footprint Experience
We supported carbon footprinting of the Royal Orange County Residential Housing Project as well as for two townships of Lohegaon and Zandewadi in Pune, respectively. Besides this, internal capacity building and skill development for the Orange County Foundation team was conducted to equip them with skills for calculating the carbon footprint of their construction projects. [Links to detailed reports of the three projects mentioned, are given in a box below. An overview of learnings from engagement with carbon footprint projects is provided at the end of this section, too.]
In the case of Orange County, a comparison was made between their previous projects and the Royal Orange County (ROC) Residential Housing Project which incorporated low carbon efforts such as eco-friendly architectural design buildings, renewable energy, waste management, wastewater management and low-carbon embodied construction and building materials. The calculation of the carbon footprint of the construction phase by the Orange County team revealed 15% lower emissions for the ROC construction compared to their previous projects. It should also be noted that Orange County incorporates sustainable principles in its construction projects by default and comparing the life cycle carbon footprint (fn3) of the ROC with other builder projects in Pune would probably demonstrate a much larger difference in emissions.
In the case of Lohegaon and Zandewadi townships in Pune, Maharashtra, we were asked to conduct carbon footprinting at the request of VK:e environmental, an architecture consultant. The project builders were required to submit a carbon footprint projection report including measures they would undertake to mitigate emissions to the State Environment Committee (SEC), Maharashtra prior to the start of the project. At the time, there wasn’t a standardized protocol available for township carbon footprinting (currently a GHG Protocol for Cities is widely used), so CB used multiple protocols to ensure quality measurements. This was undertaken considering that multiple iterations of footprinting using different protocols would lead to similar conclusions which would strengthen belief in the mitigation recommendations that would be suggested.
Following were the findings after conducting life-cycle carbon footprints of the two townships:
Township
Emissions
Mitigation Potential
Business As Usual (BAU)
Low carbon scenario
Lohegaon
3.51 million ton CO2e
2.48 million ton CO2e
1.02 million ton CO2e
Zandewadi
3.15 million ton CO2e
2.24 million ton CO2e
0.90million ton CO2e
Recommendations were conveyed to enable the builders to incorporate low carbon measures during the building process. Few of the recommendations that were suggested include: 1. Using natural afforestation methods rather than conventionally used plantation-forestry methods to compensate for the carbon absorption capacity that would be lost due to irreversible damage caused to the land on which the construction would occur. This recommendation suggested planting native trees and using the Miyawaki method of afforestation. 2. Reducing energy consumption by integrating passive design techniques such as the use of thermal mass to reduce heat gain, insulating materials or cavity walls, appropriate shading strategies for fenestration, low-U glazing, low-E films, and heat-reflective paints. 3.Inclusion of structure and radiant cooling systems within all floor and ceiling slabs to mitigate solar heat gain through rooftops and walls. 4. Designing flats in a manner that enables integration of natural refrigerant-based split ACs should the flat owners choose to install an AC.
Illustrations of Passive cooling strategies.
In comparing the projects; Orange County through implementation of low carbon measures actually demonstrated mitigation gains, whereas in the case of the two townships only the potential mitigation gains were revealed. Thus, while we participated in SEC hearings to encourage the SEC to approve the carbon footprint report and clear the township projects only if the builders take steps that align with the recommendations made, this was the extent of our influence. It still remains the purview of the SEC and other industry boards/ government authorities to compel builders to implement actionable steps towards reduction, compared to BAU construction.
Way forward
If the potential for environmental safeguarding during construction is no longer in question, then other factors must influence the decision to do so. What would make it accessible and worthwhile for builders to carry out these activities? According to Nilesh two critical obstacles for builders are the lack of investment in the sector and the lack of demand from end-users. For both, carbon footprinting presents itself as a step towards addressing these gaps.
An open disclosure tool, similar to other online tools, requires users to merely submit relevant data, which is then automatically processed to display the final results. Such a tool would enable multiple builders to present their carbon footprint calculations which would essentially create a feedback loop that shows where buildings can undertake at least the well-known measures to control carbon emissions such as using local materials, ensuring energy reduction during the operations phase, conservation etc. A life cycle carbon footprint additionally shows not only the savings at the time of construction but also the potential future energy and emissions savings (during occupation). Last, but definitely not least, it also shows where sustainable solutions pay back over time even those that may initially cost more. With such data it is possible to show investors and government and regulatory bodies from the local municipal level right up to the national and international levels, that such benefits can and should be tied to decision making and evidence-based policy making that favours and rewards responsible construction.
CBalance can create an affordable, sensitive and user-friendly tool and would invite industry associations such as the Confederation of Real Estate Developers’ Associations of India (CREDAI) to collaborate in this to encourage an increasing number of builders to voluntarily engage in carbon footprinting. This, along with recommendations based on the marginal abatement cost curve, can give builders a range of emissions mitigation opportunities from the least cost option to the highest cost. Additionally, our experience with building in-house capacity for carbon footprinting itself with the Orange County team showed that this too was not difficult. Thus, we recommend using a standard protocol for measurement and coupling in-house capacity building and engagement with consultants who are experienced in the field, to provide appropriate mitigation measures.
At this stage, it is in the collective hands of the builders to push for responsible construction processes at a larger scale, benefitting both, the building economy and the planet as a whole. If they have the vision and will to do so, carbon footprinting and cost-efficient sustainable alternatives like passive design techniques can easily replace ecologically destructive and expensive practices like air-conditioned glass buildings. Builders like Orange County have found ways to translate the wide variety of benefits it holds for residents and the wider community. Ultimately, raising the level of demand for responsible construction from multiple quarters can make shared responsibility and accountability a grounding and enlivening force for the building economy rather than an unwanted burden to be passed off or signed off on at the first opportunity. It will take many more Orange Countys and many more young builders like Nilesh to tip the scales and make sustainable the default. Whether you’re a builder, business person, government official, concerned consumer or citizen, at this juncture in time with climate chaos knocking at the doors of each one, which way you choose to step or what you choose to put your weight behind may change the course of not just your life but the nation and the planet too.
(1) A green building incorporates design techniques, materials and technologies that minimize its overall impacts on the environment and human health. This is achieved by better siting, design, material selection, construction, maintenance, removal, and possible reuse. Main outcomes are minimum site disruption, reduced fossil fuel use, lower water consumption, and fewer pollutants used and released during construction, occupation and disposal of the building. (UNESCAP, 2012)
cBalance has been engaging with Wipro, an Indian Information Technology Services Corporation, to estimate their GHG emissions from air travel since 2015.
The objective of the project has been to estimate GHG emissions from air travel, analyze Wipro’s flying patterns, estimate possible reductions in GHG emissions and recommend strategies to reduce GHG emissions.
The analysis was adhered to GHG Protocol’s Corporate Standard, accompanied by IPCC Guidelines 2006 to calculate airline specific emission factors (insert footnote)
Following the equation:
GHG Emissions = Activity Data x Emission Factor
Here, the Activity Data was the distance between Airport A to Airport B, calculated using great circle equation.
Emission factor was given in terms of kg CO2e / pax-km for each airline, distinguished based on whether the flight was International or Domestic and whether the flight was short, medium or long haul (this was determined based on the distance).
For FY 2014-2015 estimated GHG emissions were 170.1 thousand tonnes CO2e, with 1,269.8 million pax-km traveled across 5.0 lac flights
For FY 2015-2016 estimated GHG emissions were 152.9 thousand tonnes CO2e, with 1,134.4 million pax-km traveled across 4.7 lac flights
During these two cycle of analysis, other than estimating the GHG emissions from air travel, the major emphasis was on quantifying reduction potential and study reduction strategies. This was achieved by modeling two scenarios :
Best-In-Class Switch :
The goal of this scenario was to determine, for a given flight, the best airline in terms of emission factor ranking for its specified route. This helped us and Wipro quantify reduction potential just by switching over to a more efficient airline.
The estimated GHG emissions reduction from Best-In-Class switch for FY 2014-2015 were 59.9 thousand tonnes CO2e and for FY 2015-2016 were 36.9 thousand tonnes CO2e
Multi-stop to Non-stop Switch :
The goal of this scenario was to determine possible reductions in GHG emissions switching from a multi-stop flight to a non-stop flight.
The estimated GHG emissions reduction from Multi-stop to Non-stop switch for FY 2014-2015 were 19.4 thousand tonnes CO2e and for FY 2015-2016 were 11.7 thousand tonnes CO2e
In total, 79.3 thousand tonnes CO2e and 48.6 thousand tonnes CO2e reductions were estimated respectively for FY 2014-2015 and FY 2015-2016
A white paper titled Reducing Air Travel Emissions can be read here, where we have ranked airlines based on their GHG Emission Factor.
FY 2016-2017 & FY 2017-2018
For FY 2016-2017 estimated GHG emissions were 130.2 thousand tonnes CO2e, with 923.7 million pax-km traveled across 2.1 lac flights
For FY 2017-2018 estimated GHG emissions were 116.5 thousand tonnes CO2e, with 836.8 million pax-km traveled across 1.9 lac flights
Since the recommendations of flying the best-in-class airline, flying non-stop over multi-stop and choosing to travel via railways and/or use video calling services were already implemented, during these cycle only emission estimation was conducted on the business unit level.
For future development, the goal is to implement emissions and a financial budgeting system with respect to flying on a business unit level with the idea that it would create responsible air travel amongst employees.
Details on the Business Units wise emissions for FY 2016-2017 can be viewed here.
Furthermore, click here to view a comparison between Economy vs Business Class emissions between FY 2016-2017 and FY 2017-2018
Eliminate Carbon Emissions (ECE) Pvt. Ltd was contracted by the IPL Management upon the recommendation of the United Nations Environment Program (UNEP) to calculate the IPL’s annual carbon footprint (i.e. an inventory of the total greenhouse gas emissions – GHGs – that contribute to climate change, resulting from direct and indirect resource consumption through DLF IPL 2010’s annual operations).
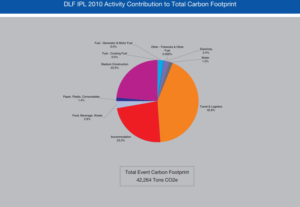
The total carbon footprint of DLF IPL 2010 was estimated to be 42,264 tons CO2e. DLF IPL 2010’s Carbon Footprint can be thought of as requiring 169,055 trees to ‘neutralise’ its impact on climate change over a period of 20 years. This equates to approximately 2,818 trees per match.
The following activities comprise its carbon Footprint, in order of decreasing magnitude: travel and logistics (18,073 tons CO2e – 42.8%), stadium construction (9,932 tons CO2e – 23.5%), luxury hotel accommodation (9,927 tons CO2e – 23.5%) , food, beverage, and waste (1,201 tons CO2e – 2.8%) and electricity (996 tons CO2e – 2.4%). These results are displayed in the chart below:
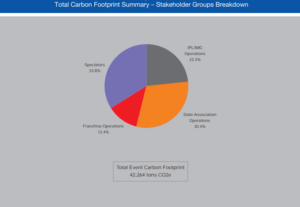
Relative stakeholder contributions to the DLF IPL 2010 Carbon Footprint are: IPL/IMG Operations (9,861 tons CO2e – 23%), state association operations (12,861 tons CO2e – 30%), franchise operations (5,243 tons CO2e – 12%), spectator activities (14,300 tons CO2e – 35%). The following chart displays the results:
A majority of the carbon footprint of DLF IPL 2010 is the consequence of activities related to its contractors, while only 23% of the footprint is a direct consequence of direct IPL/IMG managed operations. It is imperative that footprint mitigation strategies account for this aspect of footprint distribution.
Spectators are the most significant stakeholders in terms of contribution to total carbon footprint. Private vehicular travel is the single largest contributing factor – responsible for 6,517 tons CO2e (45%) of the stadium spectator carbon footprint. It is imperative to address this disproportionately heavy reliance on private transport consumed for spectator travel when addressing the overall IPL carbon footprint.
TV viewership-related carbon footprint for DLF IPL 2010 was 358,039 tons CO2e and far outweighed the contributions of any other stakeholder or activity considered within the IPL carbon footprint boundary. This component of carbon footprint, and its root cause–large quantity of consumption of electricity through TV sets–needs to be addressed with greater emphasis on its analysis and mitigation through innovative strategies and interventions in future editions of the IPL.
The impact of stadium construction, one of the primary activities contributing significantly to the IPL footprint, needs to be mitigated by intervening and exploiting opportunities to infuse low-carbon and green architecture and construction practices as the cornerstone of future stadium construction activities at proposed stadiums that are intended for use by the IPL.
Best practice examples for a majority of stakeholder functions within the IPL have been identified and quantified and their initial feasibility assessed. Best practice benchmark replication across the IPL must be pursued as a potent and actionable strategy for optimizing the carbon footprint of the IPL prior to any resource and capital-intensive carbon footprint minimisation strategies.
All interventions must be accompanied by effective communication to all internal and external stakeholders. They must also be in consonance with a well thought-out greening strategy that aims not just at a carbon neutral IPL but sets itself the loftier target of an IPL that is a net carbon sink (an indicative road map is presented in Appendix H of the original report).
Best practice incentivisation through formal programs and its incorporation into contractual negotiations processes with all vendors, contractors and other relevant stakeholders is ascertained to be the most feasible ‘first step’ on the pathway to drastically reducing the carbon footprint of IPL in the forthcoming seasons. Central IPL support and nurturing of competitive franchise behavior through formal recognition of the ‘lowest carbon footprint’ or ‘greenest’ franchise is one illustrative example that may be expanded to envelop all aspects of IPL operations in future editions.
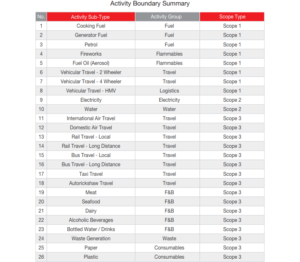
The carbon footprint determined as part of this project phase does not account for the entire life-cycle of the resources consumed and their comprehensive impact on Climate Change and ecology. Accounting for resource acquisition, processing, and disposal impacts could magnify the current extent manifold. A life-cycle analysis (LCA) of all primary resources consumed is essential to ascertain a more comprehensive carbon footprint that tends towards the true climate change impact of IPL. It is recommended that IPL 2011 be assessed on a LCA basis and that preparatory work for an LCA study be commissioned as part of the next phase of the project. The activity boundaries are outlined in the following table:
It is recommended that the IPL commission ECE to commence a comprehensive carbon footprint minimization analysis as part of a long-term ‘greening program’ (in fulfillment of its MOU with the UNEP’s Sports and Environment Unit) to identify means and alternatives for optimising and minimising its resource intensiveness.
Prior to minimising and offsetting the impact of future IPLs, it is recommended that the IPL commit to neutralise the impact of, as minimum, the four knock-out phase matches of DLF IPL 2010 (estimated to be 3,148 tons). While multiple options for offsetting are available in the conventional Carbon Offset market, the alternatives that result in equitable distribution of benefits to the grassroots stakeholder communities who are imperative to the project’s implementation are preferred as a more potent agent of social and environmental transformation.
The Orange County Foundation is a group of individuals who have experience in eco-friendly architecture and civil construction, and focus on sustainable urban development. The foundation has developed a self-sufficient green housing project at Pashan, Pune–the first of its kind–and is developing another green housing project, ‘Royal Orange County’ (ROC), at Rahatani Pune. This project involves eight multi-storied buildings, consisting a total of 353 residential flats. The ROC has adopted a number of sustainable and environment-friendly options, such as eco friendly architectural design buildings, renewable energy, waste management, wastewater management and low-carbon embodied construction and building materials.
Project Objectives:
Internal capacity building and skill development for the Orange County Foundation team to calculate the carbon footprint of their construction projects
License of authenticated database for India specific emission factors related to construction and building materials, electricity & energy, mobility, AFLOU, waste, and wastewater to map the environmental performance and sustainability impact of the Orange County Foundation’s projects
Life-cycle process mapping of the ROC construction to develop a toolkit for carbon ERP integration into their system
Carbon Footprinting of the design and construction phase of the ROC project
cBalance’s Roles:
Annual Enterprise-Use License for cBalance Carbon Emission Factor Database (CEFD) – cBalance authorized yearly subscription of the CEFD tool to the Orange County Foundation to map the carbon footprint of projects using India-specific emission factors of construction and building materials, energy, mobility, AFLOU, waste and wastewater.
Training to Orange County Foundation Team for Assessment of Carbon Footprint – cBalance team provided 16 hours extensive training to the Orange County Foundation team on the topic of carbon footprinting, life-cycle of a construction project and introduction to common carbon metrics for building operations. In addition, cBalance provided training on the CEFD tool and instructed how the CEFD can be helpful to choose sustainable and low-carbon activity or material alternatives.
Life-cycle Process Mapping and Toolkit Development for Carbon Footprint – The cBalance team visited the construction site and project office of the ROC. Through a site audit and interviews with project officers, cBalance mapped the activities related to the design and construction phase of the ROC. Thereafter, cBalance developed a toolkit that integrated into their existing system for mapping the life-cycle carbon footprint of the ROC and future projects.
Carbon Footprinting of Royal Orange County Residential Housing Project – The cBalance team collected data from the ROC on deforestation, electricity, fuels, and construction and building materials consumption of the construction phase of the ROC and calculated the construction phase carbon footprint using India-specific GHG emission factors. Finally, the cBalance team presented the carbon footprint analysis to the board of the Orange County Foundation.
Results:
Subscription to the CEFD and in-person training empowered Orange County Foundation team to:
calculate the carbon footprint of their projects using India-specific GHG emission factors
assess life-cycle environmental performance and sustainable impact of their projects
choose sustainable alternatives over conventional construction and building material
compare environmental performances of two different construction projects
create a baseline and frame future strategies to reduce the carbon footprint
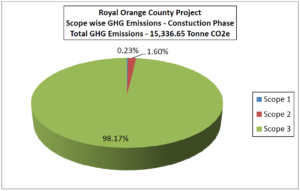
The Orange County Foundation team calculated the carbon footprint of the ROC construction phase and successfully achieved a 15% reduction in GHG emissions compared with previous projects.
The above graph demonstrates this 15% reduction. Below, the GHG emissions from the construction phase categorized by scope are displayed. As is obvious, almost all of the emissions were Scope 3.
This blog post summarizes the carbon footprint calculation conducted by Eliminate Carbon Emissions Pvt. Ltd to measure the greenhouse gas emissions of the Neemrana Fort Palace Hotel (pictured below).
Goals and Scope:
The project goals were to determine with the great degree of accuracy possible the total resource consumption inventory, total carbon footprint, and the activity-differentiated carbon footprint of the Neemrana Fort Palace Hotel’s operations. The activity boundaries were categorized as Scope 1, 2, and 3 emissions, with the results displayed in the following table.
The stakeholders were defined as the primary realizer (Neemrana Fort) and the fruit jam production facility (Nainital). While many activities resulted in direct emissions (Scope 1), some resulted in indirect emissions through the generation of electricity (Scope 2), and the emissions caused by the production of goods used (Scope 3) must be included as well in a GHG inventory. The emissions of the latter group were calculated using the life cycle assessment.
Results:
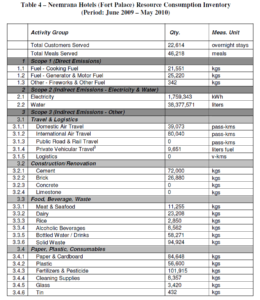
The following table presents the extrapolated aggregated resource consumption inventory for the Neemrana Fort Palace Hotel.
This resource consumption resulted in a total of 3,282 tons CO2e of 0.145 tons CO2e per stay from the period of June 2009 to May 2010. The results, categorized by activity, are displayed below.
As is obvious from the results, the vast majority of the greenhouse gas emissions came from the generation of electricity (83.5%). While nothing else came close, the GHG emissions from water (2.3%), generator usage (2.5%) and meat and seafood (2.6%) were also significant. Food, beverage, and waste as a category contributed 6.2% of the total emissions. The same results are displayed in the pie chart below.
Conclusion:
With electricity generation being responsible for so much of the hotel’s GHG emissions, efforts to reduce these emissions should focus on reducing electricity consumption. Staff and guests can work together to use less electricity through a number of voluntary (or mandatory) measures.
Eliminate Carbon Emissions (ECE) Pvt. Ltd was contracted by the ‘ENGINEER 2010’ CORE to calculate their Carbon Footprint Calculation (i.e. an inventory of the total Greenhouse Gas Emissions that contribute to Climate Change), resulting from direct and indirect resource consumption through the annual technical fest’s operations. The subsequent report encompassed the first phase–‘Realise’– of the three-phase project comprising of Carbon Footprint Calculation (‘Realise’), Carbon Footprint Minimisation
(‘Minimise’) and Carbon Footprint Neutralisation (‘Neutralise’). This blog post discusses the findings of this report.
Project Goals and Scope:
The goals of the ‘Realise’ phase of the project were, to determine for ENGINEER 2010 the total resource consumption inventory, total carbon footprint, activity-differentiated annual carbon footprint, stakeholder-differentiated annual carbon footprint, and contextualization of total carbon footprint and carbon emissions intensity of stakeholder operations. The analysis of those aspects of operation would form a benchmark for assessing the impact of future members, and the aggregate and dissected carbon footprints were to be communicated in easily understandable terms. The results of this research were intended to serve as a diagnostic tool to help mitigate future carbon emissions.
Boundaries were defined in consultation with ENGINEER Management and involved two key-decision making areas, activities to be included and stakeholders to be considered. See previous blog post for discussion of protocols followed. More attention is paid to activities that are defined as ‘Key Source Categories, which are defined as those whose collective contribution account for 95% of the total footprint (when added incrementally in order of decreasing contribution). Activity boundaries categorized as Scope 1, 2, and 3 can be found in Table 1 on page 8 of the original report. Stakeholder boundaries were determined through consultation with the Client, and the results are displayed in the table below:
The following table presents the extent of LCA incorporated into the Emission Factors selected for the Carbon Footprint calculation.
Methodology:
Activity data was collected through periodic meetings with ENGINEER CORE representatives. Questionnaires were used to define relevant stakeholder groups and activities as well as to create an “activity vs. stakeholder mapping.” Electricity, water, and fuel consumption data was obtained from the previous year’s data to begin developing a pre-event estimate. To collect visitor travel activity data, detailed quantitative audience research was conducted to measure emissions, with a sample size of 10% of the expected audience being selected at random to answer a questionnaire.
Activities included within the footprint boundary were further differentiated into multiple activity sub-types. The results are displayed in table 4 on page 13 of the original report. Activity data was then multiplied by the appropriate GHG Emissions Factors developed for India, displayed in Appendix B of the same report.
Results:
The following table presents the extrapolated aggregated resource consumption inventory for ENGINEER 2010.
The total Carbon Footprint of ENGINEER 2010 for the activities presented in the first table and the stakeholders in the second is estimated to be 29.3 tons of CO2e. The following table and figure present the contributions to this total footprint differentiated across all activity groups.
As demonstrated here, travel and logistics was the largest contributor (11.2 tons CO2e–38.4%), and electricity was the second largest (9.6 tons CO2e–32.8%). Food, beverage, and waste was a distant third (4.4 tons CO2e–14.9%).
The following table and figure present the stakeholder contributions to the Carbon Footprint of all activities included within the footprint boundary.
The largest contribution is from activities related to the ENGINEER CORE (9.7 tons CO2e–33.0%).
For discussion of assumptions, data gaps, and limitations, read the original report.
Conclusion:
The Carbon Footprint estimate of 29.3 tons CO2e to serve a participant and visitor base of 4,233 persons leads to a per-participant served Carbon Footprint of approximately 6.9 kg CO2e. It must be noted, however, that the carbon efficiency of the participant stakeholder group is very high due to their use of mass transit systems and low reliance on private vehicular transport to the event. Moreover, guest accommodation was handled using in-house facilities. The elimination of luxury hotel accommodations had a drastic impact on the Carbon Footprint, as the arrangement allows for energy efficiency control and monitoring within the event premises that leads to much greater efficiency than is seen in the luxury hospitality industry in India.
In order to optimize resource and energy consumption, a few measures were recommended in the original report: Indoor temperatures can be raised by two degrees Celsius, lights can be switched off two hours per week, and home composting systems can be used for the disposal of biodegradable waste.
This blog post summarizes the carbon footprint calculation (i.e. an inventory of the total Greenhouse Gas Emissions (GHGs) that contribute to Climate Change resulting from direct and indirect resource consumption through event activities) of the IIM(A)’s CHAOS 2010 annual cultural festival, which was contracted to Eliminate Carbon Emissions Pvt. Ltd by the festival’s Organizing Committee.
Goals:
The project goals were to determine, with the great degree of accuracy possible, the following for CHAOS 2010:
Boundaries for the Carbon Footprint Calculation process were defined in consultation with CHAOS 2010 Management. Defining boundaries involved two key-decision making areas: activities to be included (i.e. defining a comprehensive yet manageable set of resources who’s consumption was to be inventoried) and stakeholders to be considered as part of the organization’s footprint (i.e. defining which sets of peoples/groups/functions are to be included within the footprint boundary).
Scope:
Since Carbon Footprint Reporting for events in India is not mandated by either the Indian Government or the United Nations Framework Convention for Climate Change (UNFCCC), and CHAOS 2010’s initiative to address its Climate Change Impacts is purely voluntary, there was no set of pre-established guidelines for boundary definition to be followed. Thus, the globally accepted methodologies for National GHG Emissions Reporting (adopted by India as part of the Kyoto Protocol) laid down by the IPCC (Inter Governmental Panel on Climate Change) as part of the 2006 Guidelines were used for guidance wherever appropriate. However, given the unique nature of this event, the overall methodology reflected a confluence of standard protocols and event-appropriate approaches which provide an accurate estimate of the Climate Change impact of a unique cultural and live-entertainment event, which CHAOS represents.
Activity Boundaries:
Contributing Directly to Carbon Footprint: Cooking Fuel Consumption, Vehicular Fuel Consumption (these are activities where an individual or business has direct control over the amount of activity and the emission coefficient through technological choices)
Contributing Indirectly to Carbon Footprint (Primary Importance): Electricity Consumption, Water Consumption (these are activities where an individual or business has direct control over the amount of activity but not the emission coefficient through technological choices)
Contributing Indirectly to Carbon Footprint (Secondary Importance): Transportation (Rail, Road, and Air Travel), Food & Beverage comprising of Meat, Seafood, Dairy, Rice, Alcoholic and Bottled Water/Soft Drink Beverage Consumption, Waste Generation, Plastic, Paper and Other Consumables (these are activities where an individual or business can be considered to not have direct control over the amount of activity nor the emission coefficient through technological choices)
Stakeholder Boundaries:
CHAOS 2010 Organization
Event Performers
Event Participants
Life-cycle Boundaries:
Methodology
The research methodology followed for the project centered around the idea of dissecting the event operations and disaggregating the consumption of resources to understand the consumption patterns ‘ground-up’. While this approach was more time-consuming, as opposed to tracking all activities through a ‘centralized’ approach, it helped construct a detailed footprint-map that would be invaluable as an analysis tool to identify stakeholder contributions to overall footprint. This data was then refined and scrutinized for inaccuracies when data appeared to be erroneous.
Results
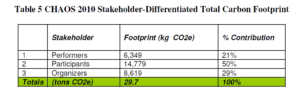
The total carbon footprint of CHAOS 2010 for the activities and stakeholders presented previously is estimated to be 29.7 tons of CO2e.
Table 4 presents the contributions to the total carbon footprint differentiated by scope. Items identified as ‘not known’ represent data that was unavailable for analysis due to constraints encountered by data gathering personnel, and underlined quantities represent activities where consumption was estimated based on an assumed per-participant consumption quantity.
Figure 7 displays the percentage of overall GHG emissions per activity. Auto-rickshaw and flights were the two largest contributors at 29% and 21%, respectively.
Table 5 displays the GHG emissions per stakeholder. The participants, at 50%, were by far the largest contributors.
Figure 2 displays the same results in a pie chart.
Conclusions
Preemptively, Participant Travel and Waste Generation Footprints may be mitigated in future events through:
provision of mass-transit based systems, such as fuel-efficient or alternative fuel (CNG) buses, to transport participants from pre-determined nodal locations in the surrounding areas of IIM(A) to the event.
waste management principles centered around waste segregation, organic waste composting, and waste recycling must be adopted in conjunction with the rigorous participant awareness effort to ensure minimal waste is sent to landfills as an outcome of CHAOS.
Finally, based on the above analysis presented earlier, it is recommended that IIM(A) offset a significant percentage of the footprint of CHAOS 2010 (29.7 tons of CO2e) through ‘domestic’ action. It is recommended that IIM(A) review its monthly electricity consumption and set a achievable ‘percentage-reduction’ target for the first quarter during the new Academic Year beginning in mid-2010 to ‘offset’ at least 50% of the 19,192 units (i.e. 10,000 units).
Bibo Water commissioned Vivek Gilani of cBalance to conduct a GHG inventory of their operations. The results are displayed in this blog post.
Project Scope
Activity Boundaries:
The following tables lists activities that were mapped as part of the inventory project and their scope:
Life cycle Boundaries:
While many activities resulted in direct emissions (Scope 1), some resulted in indirect emissions through the generation of electricity (Scope 2), and the emissions caused by the production of goods used (Scope 3) must be included as well in a GHG inventory. The emissions of the latter group were calculated using the life cycle assessment.
Stakeholder Boundaries:
Bibo Water’s physical and operational boundaries were mapped to develop a list of relevant stakeholders (internal process groups) and include their activities (i.e. direct emissions from within the boundary as well as the consumption of goods and services produced elsewhere) as part of the GHG inventory. These boundaries are summarized in the table below:
Resources
Resource Consumption Inventory:
Activity data was collected in order to record the consumption of resources for the months of December 2008, February 2009, and May 2009 and was then extrapolated linearly for an 12 month period.
GHG Inventory and Analysis:
A customized carbon ERP model was developed specifically for the project, and using the appropriate GHG emission factors, a GHG inventory was calculated. The following table summarizes the results:
The pie chart below categorizes the total carbon footprint by activity. Electricity consumption for plant production and administrative activities had by far the greatest impact, followed by emissions from distribution logistics and Scope 3 emissions from plastic use for product packaging.
The next pie chart breaks down the total carbon footprint by stakeholder (i.e. internal process groups in this project) contribution. The internal processes resulting in the greatest impact in terms of absolute magnitude (proportional to quantity of water production) were the production facility at Marvel, followed by Sangareddy and Vandana.
The GHG intensity of production across the various facilities and product lines was also analyzed. The results are displayed in the graph below. Retail production below 2 liter capacity bottles resulted in a significantly higher GHG intensity compared to the bulk production facilities/processes. Amongst the retail units, the Marvel 1 liter production line resulted in the lowest GHG intensity per liter (0.08 kg CO2e/liter) while the highest was the retail production of 300 ml bottles at Marvel. In terms of bulk production, the most efficient production unit was the 20 L production system at Sangareddy (0.005 kgCO2e/liter). The primary reason for the lower GHG intensity of retail vs. bulk units was the re-use of packaging in the case of bulk jars versus single-use PET bottles for retail packaging.
A corresponding trend, mirroring the trend of GHG intensity of Retail Production (below 2 liter capacity bottles) relative to the bulk production facilities/processes, was observed in the context of GHG intensity of logistics operations; logistics for retail units exhibited significantly greater GHG intensity compared to bulk units. The primary reason for the lower GHG intensity of logistics for retail vs. bulk logistics is the smaller network coverage (within the urban center) of the bulk operations relative to the state-wide logistics operations involved in the case of retail units. Furthermore, fuel efficiency of vehicle types used for the retail versus bulk lines had a significant impact on the consequent GHG intensity of logistics operations. The results are shown in the graph below.
The following two graphs show the carbon footprint of the different product lines broken down by activity group.
We continue our blog with another post on the hotel industry, this time discussing Mumbai’s 5 star hotel Meluha the Fern, which commissioned cBalance to provide an analysis of its ecological footprint and consumption for the years of 2011-12. Meluha the Fern is a business hotel located in a hot and humid climatic zone (see our last blog post for more information on the different climatic zones) with 141 rooms. Laundry and waste water treatment (aerobic) is off-site, and the average room tafiff is Rs. 6400.
Greenhouse Gas Inventory:
As is evident from the graph, the vast majority of emissions come from electricity generation (84.45%). Laundry is the second largest source (3.88%), followed by PNG (3.48%, dairy (2.49%, and meat (2.27%).
The total footprint of the hotel was 4224.47 tCO2e, with 0.12 tCO2e per overnight stay, 0.34 tC02e per square meter, and 29.9 tCO2e per room per year.
Compared to its peers, Meluha the Fern is in the top 2 percentile for overall energy efficiency, top 4 percentile for hotels in the Hot & Humid climatic zone, top 9 percentile for all 5 star hotels, and top 2 percentile for all business hotels.
Results:
The total CO2e for the reporting period was 1263 tCO2e, with 919.34 tCO2e from guestrooms and 343.23 tCO2e from meetings. The carbon footprint per occupied room on a daily basis was 27.2 kgCO2e and 94.0 kgCO2e per area of meeting space.
The carbon footprint of fuel usage overwhelmingly came from PNG (69%), followed by LPG (18%) and diesel (13%). The cost was even more lopsided, with 96% from PNG and 2% each from LPG and diesel.
Carbon emissions was not the only performance indicator we analyzed, however; water consumption was also evaluated. 29069 kiloliters of water was used by Meluha the Fern (resulting in associated emissions of 16.1 tCO2e). Most of it came by tanker (56%), and domestic water (48%), flushing (25%), and the cooling towers (23%) were responsible for nearly all of its use.
cBalance also analyzed Meluha the Fern’s food waste, which totaled at 112.78 tonnes (resulting in 2.9 tCO2e emissions), 90% of which went to the piggeries, with the remaining 10% being composted.
Laundry is another significant contributor to Meluha the Fern’s ecological footprint. There were 639.96 tons of laundry with an associated emissions of 163.83 tCO2e (260 kgCO2e per ton). The tent card, however, helped save 2% of laundry, meaning 1460 kWh of electricity, 480 KL of water, 700 I of furnace oil, and 4.4 tCO2e GHG emissions per year.
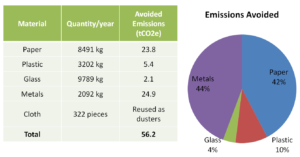
The following table and graph illustrate Meluha the Fern’s solid waste management:
Most of the avoided emissions were from metals (44% and paper 42%).
Meluha the Fern has also achieved large savings from its water practices. The campus area is 1046 square meters, while the rainwater capture area is 3130.55 square meters. 7% of capture rainwater is reused (360 KL per year), and 93% of captured rainwater is recharged into the ground (4782 KL per year).
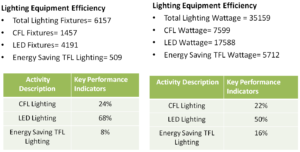
Energy savings result from Meluha the Fern’s choices of lighting equipment, as is shown by the following data:
Meluha the Fern also uses more sustainable forms of indoor cooling, with 10 split AC units (16 tonnes) and 50% of tonnage rated as 3 star equipment or above.
There are other areas as well where Meluha the Fern is able to save energy. 24% of the total pumping capacity comes from VFD pumps. Measures are taken to reduce refrigeration, 6% of the BUA is naturally lit, all of the windows are double-glazed, and all of the water pipes are insulated. 29% of the BUA is covered by BMS (building management systems), and the occupancy controlled area is 49% of the low traffic BUA area.
Some other notable sustainability measures included induction stoves for buffet counters, three self-cooking centers from Rational, a four bin method of trash segregation (at the source), no straws, paper napkins, or coasters, and glass bottles provided for water rather than bottled water (which aren’t filled unless asked for). Lastly, email usage is mandated and recycled paper is used for all stationary.
Other positives were that the data collection in housekeeping and engineering departments was excellent, and all staff members were very knowledgeable about sustainability initiatives within their departments.
Areas for improvement:
There were no sustainability initiatives involving guests, and the percentage of social development activities was very less (less than 1% of total man hours). There were not any norms for the use of organic food, either.
Schneider Electric Pvt. Ltd. commissioned cBalance to prepare a report showcasing the total carbon footprint of ‘Xperience Efficiency Yatra-2013,’ an event held across 44 cities that demonstrated how new energy technologies can change our lives and was attended by 11,792 customers and 3,422 Schneider Electric employees. The greenhouse gases (GHG) inventory was calculated using the sample data of 11 cities provided by Schneider Electric and generalizing for all 44 cities and accounted for the three major greenhouse gases: carbon dioxide (CO2), methane (CH4), and nitrous oxide (N2O). It was calculated according to the standards laid down in the GHG Protocol.
In the case of this report, the operational boundary for the GHG inventory was defined as:
Research Methodology
The research methodology consisted of the following steps:
Design questionnaire
Data collection
Data verification
GHG inventory calculations
Daya analysis
Reporting
Data
Data was obtained through a questionnaire designed by cBalance and collected by the Schneider Electric Marcom team at two levels: central and venue.
Central level data came from the back office of the Marcom team and included information such as hotel accommodations, communication materials, and air, rail, and bus travel of Schneider Electric employees, etc. It was available for all the 44 city events and the GHG emissions of these activities are, thus, calculated for all of them.
Venue level data was collected at the venues with the hotel staff as respondents. A universally applicable sample of 11 cities’ data was analyzed at the venue level.
cBalance used Footprint Reporter (FPR) to calculate GHG emissions, with the Footprint Report Emission Factor Database (EFDB) used as background data.
Electricity consumption:
Electricity consumption was calculated by using the number of hours the floor space of the venue was used for the event, with predefined electricity usage per square meter for 3 star, 4 star, and 5 star facilities being used for the analysis. It’s assumed that each session is 4.5 hours long (3 for assembly and 1.5 for disantling) and that events take place for 15 days in a month with an average of 8 hours per event.
Air travel:
Air travel activity data was calculated by estimating average passenger-km per flight (modeling that single flight by short, medium, and long haul type in FPR) and multiplying the footprint of each flight type by the total quantity of landings/take-offs (including stopovers), including circling-inefficiency (for domestic travel), per flight type. Short haul distances are defined to be between 0 to 694.5 km, Medium Haul distances defined as 995 to 1,620.5 km, and Long Haul distances are defined as 1,621 to 2,778 kms.
City travel and intercity travel of attendees:
The intercity travel of the attendees was considered to be 10% of the total attendees, with the other 90% traveling within the city. It was calculated for all modes of transport using the same data of city and intercity travel and was then estimated for the grand total attendees for all the events.
Accommodation:
Total overnight stay of employees of Schneider Electric in 3 star, 4 star, and 5 star facilities in different climatic zones (i.e. warm and humid, hot and dry, temperate) was computed and then modeled in FPR.
Food and Beverage:
It was assumed that every attendee consumed a liter of water at the event, and the emission per meal served was considered to be 0.855 kgCO2e.
Other activity data:
This included fuel consumption for diesel generator, heavy motor vehicles used in the logistics of the event, train and bus travel of Schneider Electric employees, and the total weight of recycled bags and brochures used.
Results
Scope 1, 2, 3 GHG Emissions:
As shown by the table and chart below, Scope 3 emissions were the largest contributor, at 57.8%, and Scope 1 emissions were the second largest, at 28.8%.
Scope 1 GHG emissions:
Heavy motorized vehicles used for event logistics were far and away the largest source of Scope 1 emissions, as is evident from the table and chart below.
Scope 2 emissions:
As demonstrated by the following table, all Scope 2 emissions are the consequence of electricity use. In terms of total magnitude, these emissions have a relatively low impact on the total GHG emissions as the events are not energy intensive and do not rely upon electrically powered machines or processes. These emissions consist of both- electricity purchased and AT&C losses.
Scope 3 emissions:
The table and chart below make it clear that accommodation was the largest source of Scope 3 emissions, followed by intercity travel.
Activity category-wise emissions:
Breaking down the emissions by activity gives us a different perspective from which to view the event’s carbon footprint. Accommodation was the single largest contributor to activity category-wise emissions, with 31.4 % of total GHG emissions, followed by logistics (24.0%). Intercity travel and purchased electricity consumption were also significant, at 15.7% and 13.4%, respectively. The rest were rather minor contributors.
Conclusion
This illustrates the total Carbon Footprint Summary of all the 44 city events as well as an average representing that for each city event. Total GHG emissions for all 44 city events amount to 388.384 Tonnes of CO2e, while GHG emissions per city event are 8.827 Tonnes of CO2e.


")