Bibo Water Carbon Footprint Project
Bibo Water commissioned Vivek Gilani of cBalance to conduct a GHG inventory of their operations. The results are displayed in this blog post.
Project Scope
Activity Boundaries:
The following tables lists activities that were mapped as part of the inventory project and their scope:
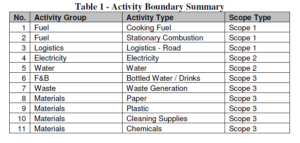
Life cycle Boundaries:
While many activities resulted in direct emissions (Scope 1), some resulted in indirect emissions through the generation of electricity (Scope 2), and the emissions caused by the production of goods used (Scope 3) must be included as well in a GHG inventory. The emissions of the latter group were calculated using the life cycle assessment.
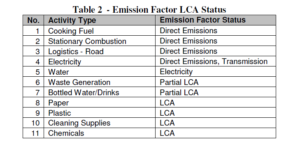
Stakeholder Boundaries:
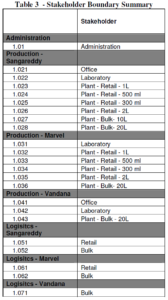
Bibo Water’s physical and operational boundaries were mapped to develop a list of relevant stakeholders (internal process groups) and include their activities (i.e. direct emissions from within the boundary as well as the consumption of goods and services produced elsewhere) as part of the GHG inventory. These boundaries are summarized in the table below:
Resources
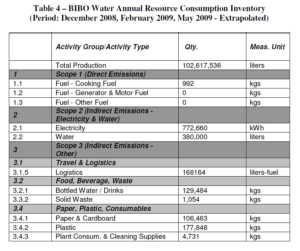
Resource Consumption Inventory:
Activity data was collected in order to record the consumption of resources for the months of December 2008, February 2009, and May 2009 and was then extrapolated linearly for an 12 month period.
GHG Inventory and Analysis:
A customized carbon ERP model was developed specifically for the project, and using the appropriate GHG emission factors, a GHG inventory was calculated. The following table summarizes the results:
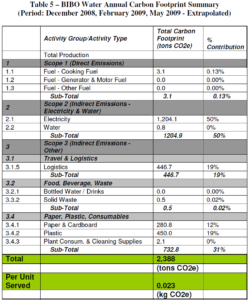
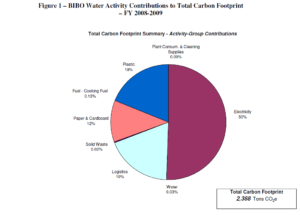
The pie chart below categorizes the total carbon footprint by activity. Electricity consumption for plant production and administrative activities had by far the greatest impact, followed by emissions from distribution logistics and Scope 3 emissions from plastic use for product packaging.
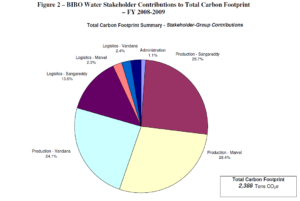
The next pie chart breaks down the total carbon footprint by stakeholder (i.e. internal process groups in this project) contribution. The internal processes resulting in the greatest impact in terms of absolute magnitude (proportional to quantity of water production) were the production facility at Marvel, followed by Sangareddy and Vandana.
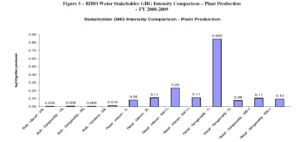
The GHG intensity of production across the various facilities and product lines was also analyzed. The results are displayed in the graph below. Retail production below 2 liter capacity bottles resulted in a significantly higher GHG intensity compared to the bulk production facilities/processes. Amongst the retail units, the Marvel 1 liter production line resulted in the lowest GHG intensity per liter (0.08 kg CO2e/liter) while the highest was the retail production of 300 ml bottles at Marvel. In terms of bulk production, the most efficient production unit was the 20 L production system at Sangareddy (0.005 kgCO2e/liter). The primary reason for the lower GHG intensity of retail vs. bulk units was the re-use of packaging in the case of bulk jars versus single-use PET bottles for retail packaging.
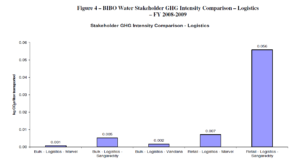
A corresponding trend, mirroring the trend of GHG intensity of Retail Production (below 2 liter capacity bottles) relative to the bulk production facilities/processes, was observed in the context of GHG intensity of logistics operations; logistics for retail units exhibited significantly greater GHG intensity compared to bulk units. The primary reason for the lower GHG intensity of logistics for retail vs. bulk logistics is the smaller network coverage (within the urban center) of the bulk operations relative to the state-wide logistics operations involved in the case of retail units. Furthermore, fuel efficiency of vehicle types used for the retail versus bulk lines had a significant impact on the consequent GHG intensity of logistics operations. The results are shown in the graph below.
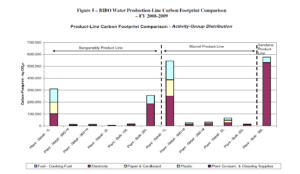
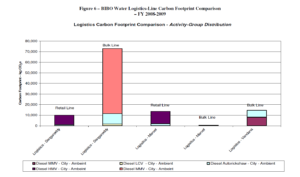
The following two graphs show the carbon footprint of the different product lines broken down by activity group.
The original report can be read here.
Comments are closed