cBalance has been engaging with Wipro, an Indian Information Technology Services Corporation, to estimate their GHG emissions from air travel since 2015.
The objective of the project has been to estimate GHG emissions from air travel, analyze Wipro’s flying patterns, estimate possible reductions in GHG emissions and recommend strategies to reduce GHG emissions.
The analysis was adhered to GHG Protocol’s Corporate Standard, accompanied by IPCC Guidelines 2006 to calculate airline specific emission factors (insert footnote)
Following the equation:
GHG Emissions = Activity Data x Emission Factor
Here, the Activity Data was the distance between Airport A to Airport B, calculated using great circle equation.
Emission factor was given in terms of kg CO2e / pax-km for each airline, distinguished based on whether the flight was International or Domestic and whether the flight was short, medium or long haul (this was determined based on the distance).
For FY 2014-2015 estimated GHG emissions were 170.1 thousand tonnes CO2e, with 1,269.8 million pax-km traveled across 5.0 lac flights
For FY 2015-2016 estimated GHG emissions were 152.9 thousand tonnes CO2e, with 1,134.4 million pax-km traveled across 4.7 lac flights
During these two cycle of analysis, other than estimating the GHG emissions from air travel, the major emphasis was on quantifying reduction potential and study reduction strategies. This was achieved by modeling two scenarios :
Best-In-Class Switch :
The goal of this scenario was to determine, for a given flight, the best airline in terms of emission factor ranking for its specified route. This helped us and Wipro quantify reduction potential just by switching over to a more efficient airline.
The estimated GHG emissions reduction from Best-In-Class switch for FY 2014-2015 were 59.9 thousand tonnes CO2e and for FY 2015-2016 were 36.9 thousand tonnes CO2e
Multi-stop to Non-stop Switch :
The goal of this scenario was to determine possible reductions in GHG emissions switching from a multi-stop flight to a non-stop flight.
The estimated GHG emissions reduction from Multi-stop to Non-stop switch for FY 2014-2015 were 19.4 thousand tonnes CO2e and for FY 2015-2016 were 11.7 thousand tonnes CO2e
In total, 79.3 thousand tonnes CO2e and 48.6 thousand tonnes CO2e reductions were estimated respectively for FY 2014-2015 and FY 2015-2016
A white paper titled Reducing Air Travel Emissions can be read here, where we have ranked airlines based on their GHG Emission Factor.
FY 2016-2017 & FY 2017-2018
For FY 2016-2017 estimated GHG emissions were 130.2 thousand tonnes CO2e, with 923.7 million pax-km traveled across 2.1 lac flights
For FY 2017-2018 estimated GHG emissions were 116.5 thousand tonnes CO2e, with 836.8 million pax-km traveled across 1.9 lac flights
Since the recommendations of flying the best-in-class airline, flying non-stop over multi-stop and choosing to travel via railways and/or use video calling services were already implemented, during these cycle only emission estimation was conducted on the business unit level.
For future development, the goal is to implement emissions and a financial budgeting system with respect to flying on a business unit level with the idea that it would create responsible air travel amongst employees.
Details on the Business Units wise emissions for FY 2016-2017 can be viewed here.
Furthermore, click here to view a comparison between Economy vs Business Class emissions between FY 2016-2017 and FY 2017-2018
Eliminate Carbon Emissions (ECE) Pvt. Ltd was contracted by the IPL Management upon the recommendation of the United Nations Environment Program (UNEP) to calculate the IPL’s annual carbon footprint (i.e. an inventory of the total greenhouse gas emissions – GHGs – that contribute to climate change, resulting from direct and indirect resource consumption through DLF IPL 2010’s annual operations).
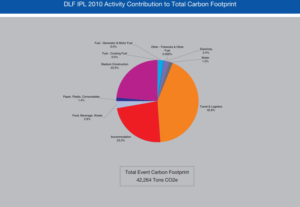
The total carbon footprint of DLF IPL 2010 was estimated to be 42,264 tons CO2e. DLF IPL 2010’s Carbon Footprint can be thought of as requiring 169,055 trees to ‘neutralise’ its impact on climate change over a period of 20 years. This equates to approximately 2,818 trees per match.
The following activities comprise its carbon Footprint, in order of decreasing magnitude: travel and logistics (18,073 tons CO2e – 42.8%), stadium construction (9,932 tons CO2e – 23.5%), luxury hotel accommodation (9,927 tons CO2e – 23.5%) , food, beverage, and waste (1,201 tons CO2e – 2.8%) and electricity (996 tons CO2e – 2.4%). These results are displayed in the chart below:
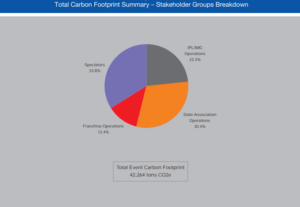
Relative stakeholder contributions to the DLF IPL 2010 Carbon Footprint are: IPL/IMG Operations (9,861 tons CO2e – 23%), state association operations (12,861 tons CO2e – 30%), franchise operations (5,243 tons CO2e – 12%), spectator activities (14,300 tons CO2e – 35%). The following chart displays the results:
A majority of the carbon footprint of DLF IPL 2010 is the consequence of activities related to its contractors, while only 23% of the footprint is a direct consequence of direct IPL/IMG managed operations. It is imperative that footprint mitigation strategies account for this aspect of footprint distribution.
Spectators are the most significant stakeholders in terms of contribution to total carbon footprint. Private vehicular travel is the single largest contributing factor – responsible for 6,517 tons CO2e (45%) of the stadium spectator carbon footprint. It is imperative to address this disproportionately heavy reliance on private transport consumed for spectator travel when addressing the overall IPL carbon footprint.
TV viewership-related carbon footprint for DLF IPL 2010 was 358,039 tons CO2e and far outweighed the contributions of any other stakeholder or activity considered within the IPL carbon footprint boundary. This component of carbon footprint, and its root cause–large quantity of consumption of electricity through TV sets–needs to be addressed with greater emphasis on its analysis and mitigation through innovative strategies and interventions in future editions of the IPL.
The impact of stadium construction, one of the primary activities contributing significantly to the IPL footprint, needs to be mitigated by intervening and exploiting opportunities to infuse low-carbon and green architecture and construction practices as the cornerstone of future stadium construction activities at proposed stadiums that are intended for use by the IPL.
Best practice examples for a majority of stakeholder functions within the IPL have been identified and quantified and their initial feasibility assessed. Best practice benchmark replication across the IPL must be pursued as a potent and actionable strategy for optimizing the carbon footprint of the IPL prior to any resource and capital-intensive carbon footprint minimisation strategies.
All interventions must be accompanied by effective communication to all internal and external stakeholders. They must also be in consonance with a well thought-out greening strategy that aims not just at a carbon neutral IPL but sets itself the loftier target of an IPL that is a net carbon sink (an indicative road map is presented in Appendix H of the original report).
Best practice incentivisation through formal programs and its incorporation into contractual negotiations processes with all vendors, contractors and other relevant stakeholders is ascertained to be the most feasible ‘first step’ on the pathway to drastically reducing the carbon footprint of IPL in the forthcoming seasons. Central IPL support and nurturing of competitive franchise behavior through formal recognition of the ‘lowest carbon footprint’ or ‘greenest’ franchise is one illustrative example that may be expanded to envelop all aspects of IPL operations in future editions.
The carbon footprint determined as part of this project phase does not account for the entire life-cycle of the resources consumed and their comprehensive impact on Climate Change and ecology. Accounting for resource acquisition, processing, and disposal impacts could magnify the current extent manifold. A life-cycle analysis (LCA) of all primary resources consumed is essential to ascertain a more comprehensive carbon footprint that tends towards the true climate change impact of IPL. It is recommended that IPL 2011 be assessed on a LCA basis and that preparatory work for an LCA study be commissioned as part of the next phase of the project. The activity boundaries are outlined in the following table:
It is recommended that the IPL commission ECE to commence a comprehensive carbon footprint minimization analysis as part of a long-term ‘greening program’ (in fulfillment of its MOU with the UNEP’s Sports and Environment Unit) to identify means and alternatives for optimising and minimising its resource intensiveness.
Prior to minimising and offsetting the impact of future IPLs, it is recommended that the IPL commit to neutralise the impact of, as minimum, the four knock-out phase matches of DLF IPL 2010 (estimated to be 3,148 tons). While multiple options for offsetting are available in the conventional Carbon Offset market, the alternatives that result in equitable distribution of benefits to the grassroots stakeholder communities who are imperative to the project’s implementation are preferred as a more potent agent of social and environmental transformation.
Recycle Guru is an online platform helping citizens recycle their waste by enabling the informal recycling sector. It promotes the more sustainable use of resources to make communities healthier and cleaner and seeks to instill greater dignity in the recycling profession as well as into the perception of citizens who rely upon their services. Recycle Guru initiates the recycling process by collecting paper, plastic, metal, and glass wastes from households in Bangalore.
The motive of this project was to create a tool to estimate the Energy and GHG Emissions (or Carbon Footprint) conservation benefits of recycling versus the business-as-usual option for municipal waste management in India: landfilling. Achieved Energy saving is contextualized in terms of equivalent hour of usage of CFLs (compact fluorescent lamps), ceiling fans, laptop, washing machine, LCD TV, and the equivalent carbon sequestration capacity of trees.
Paper
Paper waste is categorized into following categories: paper sheets, newspaper inserts, newsprint, cardboard, and magazines. The Recycle Guru team observed the percentile contribution of each waste type as the following:
Paper sheets – 95%
Newspaper Inserts – 5%
Cardboard – 60%
Magazines – 40%
Life cycle emission (implies manufacturing from Virgin material, 0% recycled material) of each subcategory mentioned above is as follows:
Using the first order decay method, the emissions from disposal is estimated to be 1.725 kg CO2e/kg of waste. The total emissions saved from recycling is calculated by subtracting the life cycle emissions of the recycled material from the life cycle emissions of the virgin material and then adding the landfilling emissions. The results are displayed in the following table:
Plastic
Plastic waste consists of the following three categories: high value plastic (high density polyethylene), PET bottles (polyethylene terephthalate), low value plastic (low density polyethylene). The life cycle emissions from manufacturing for each subcategory are displayed in the table below.
Since Degradable Organic Carbon in plastic is almost negligible, methane generation from its disposal in landfills is considered to be Zero. To calculate the avoided emissions from recycling, the same formula as that for paper was used. The results are displayed in the following table:
Metal
Metal waste only contains one category comprising both aluminum and steel. As per the pattern observed so far, percentile contribution of aluminum and steel in metal waste is found to be 75% and 25%, respectively. The life cycle emissions (implies manufacturing from Virgin material, 0% recycled material) of each subcategory mentioned above is as follows:
Since degradable organic carbon in metal is almost negligible, methane generation from its disposal in landfills is considered to be zero. Emission savings for each category is estimated using the same equation as paper and plastic with the results displayed below.
Glass
Glass waste is categorized into the following categories: beer bottles (brand: Kingfisher), container glass, and generic glass. As observed so far by Recycle Guru team, there were many instances when beer bottles were counted in pieces instead of kilogram. Hence, carbon saving from beer bottles is estimated based on number of pieces taken for recycling. Kingfisher beer bottles (made up of glass) mostly come in 650ml and 330ml. These two
major categories are considered in modeling the carbon saving from piece of each type. Life cycle emission (implies manufacturing from virgin material, 0% recycled material) of each subcategory mentioned above is as follows:
Since degradable organic carbon in metal is almost negligible, methane generation from its disposal in landfills is considered to be zero. Emission savings for each category is estimated using the same equation as paper, plastic, and metal and the results are displayed in the following two tables.
As discussed above, the energy saving achieved is expressed in terms of following contexts: CFLs (compact fluorescent lamps), ceiling fans, laptop, washing machine, LCD TV, and the equivalent carbon sequestration capacity of trees. Electricity emission factor (including AT&T Loss) for Bengaluru city is 1.27 kgCO2e/kwh generated. The following table displays the results:
To find about the assumptions taken and the equations used, the original report can be read here.
The Orange County Foundation is a group of individuals who have experience in eco-friendly architecture and civil construction, and focus on sustainable urban development. The foundation has developed a self-sufficient green housing project at Pashan, Pune–the first of its kind–and is developing another green housing project, ‘Royal Orange County’ (ROC), at Rahatani Pune. This project involves eight multi-storied buildings, consisting a total of 353 residential flats. The ROC has adopted a number of sustainable and environment-friendly options, such as eco friendly architectural design buildings, renewable energy, waste management, wastewater management and low-carbon embodied construction and building materials.
Project Objectives:
Internal capacity building and skill development for the Orange County Foundation team to calculate the carbon footprint of their construction projects
License of authenticated database for India specific emission factors related to construction and building materials, electricity & energy, mobility, AFLOU, waste, and wastewater to map the environmental performance and sustainability impact of the Orange County Foundation’s projects
Life-cycle process mapping of the ROC construction to develop a toolkit for carbon ERP integration into their system
Carbon Footprinting of the design and construction phase of the ROC project
cBalance’s Roles:
Annual Enterprise-Use License for cBalance Carbon Emission Factor Database (CEFD) – cBalance authorized yearly subscription of the CEFD tool to the Orange County Foundation to map the carbon footprint of projects using India-specific emission factors of construction and building materials, energy, mobility, AFLOU, waste and wastewater.
Training to Orange County Foundation Team for Assessment of Carbon Footprint – cBalance team provided 16 hours extensive training to the Orange County Foundation team on the topic of carbon footprinting, life-cycle of a construction project and introduction to common carbon metrics for building operations. In addition, cBalance provided training on the CEFD tool and instructed how the CEFD can be helpful to choose sustainable and low-carbon activity or material alternatives.
Life-cycle Process Mapping and Toolkit Development for Carbon Footprint – The cBalance team visited the construction site and project office of the ROC. Through a site audit and interviews with project officers, cBalance mapped the activities related to the design and construction phase of the ROC. Thereafter, cBalance developed a toolkit that integrated into their existing system for mapping the life-cycle carbon footprint of the ROC and future projects.
Carbon Footprinting of Royal Orange County Residential Housing Project – The cBalance team collected data from the ROC on deforestation, electricity, fuels, and construction and building materials consumption of the construction phase of the ROC and calculated the construction phase carbon footprint using India-specific GHG emission factors. Finally, the cBalance team presented the carbon footprint analysis to the board of the Orange County Foundation.
Results:
Subscription to the CEFD and in-person training empowered Orange County Foundation team to:
calculate the carbon footprint of their projects using India-specific GHG emission factors
assess life-cycle environmental performance and sustainable impact of their projects
choose sustainable alternatives over conventional construction and building material
compare environmental performances of two different construction projects
create a baseline and frame future strategies to reduce the carbon footprint
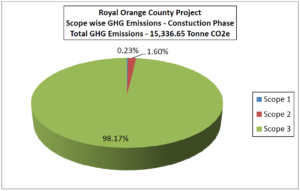
The Orange County Foundation team calculated the carbon footprint of the ROC construction phase and successfully achieved a 15% reduction in GHG emissions compared with previous projects.
The above graph demonstrates this 15% reduction. Below, the GHG emissions from the construction phase categorized by scope are displayed. As is obvious, almost all of the emissions were Scope 3.
This blog post summarizes the carbon footprint calculation conducted by Eliminate Carbon Emissions Pvt. Ltd to measure the greenhouse gas emissions of the Neemrana Fort Palace Hotel (pictured below).
Goals and Scope:
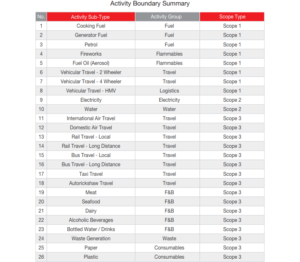
The project goals were to determine with the great degree of accuracy possible the total resource consumption inventory, total carbon footprint, and the activity-differentiated carbon footprint of the Neemrana Fort Palace Hotel’s operations. The activity boundaries were categorized as Scope 1, 2, and 3 emissions, with the results displayed in the following table.
The stakeholders were defined as the primary realizer (Neemrana Fort) and the fruit jam production facility (Nainital). While many activities resulted in direct emissions (Scope 1), some resulted in indirect emissions through the generation of electricity (Scope 2), and the emissions caused by the production of goods used (Scope 3) must be included as well in a GHG inventory. The emissions of the latter group were calculated using the life cycle assessment.
Results:
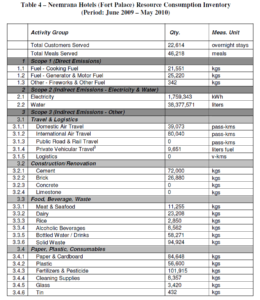
The following table presents the extrapolated aggregated resource consumption inventory for the Neemrana Fort Palace Hotel.
This resource consumption resulted in a total of 3,282 tons CO2e of 0.145 tons CO2e per stay from the period of June 2009 to May 2010. The results, categorized by activity, are displayed below.
As is obvious from the results, the vast majority of the greenhouse gas emissions came from the generation of electricity (83.5%). While nothing else came close, the GHG emissions from water (2.3%), generator usage (2.5%) and meat and seafood (2.6%) were also significant. Food, beverage, and waste as a category contributed 6.2% of the total emissions. The same results are displayed in the pie chart below.
Conclusion:
With electricity generation being responsible for so much of the hotel’s GHG emissions, efforts to reduce these emissions should focus on reducing electricity consumption. Staff and guests can work together to use less electricity through a number of voluntary (or mandatory) measures.
Eliminate Carbon Emissions (ECE) Pvt. Ltd was contracted by the ‘ENGINEER 2010’ CORE to calculate their Carbon Footprint Calculation (i.e. an inventory of the total Greenhouse Gas Emissions that contribute to Climate Change), resulting from direct and indirect resource consumption through the annual technical fest’s operations. The subsequent report encompassed the first phase–‘Realise’– of the three-phase project comprising of Carbon Footprint Calculation (‘Realise’), Carbon Footprint Minimisation
(‘Minimise’) and Carbon Footprint Neutralisation (‘Neutralise’). This blog post discusses the findings of this report.
Project Goals and Scope:
The goals of the ‘Realise’ phase of the project were, to determine for ENGINEER 2010 the total resource consumption inventory, total carbon footprint, activity-differentiated annual carbon footprint, stakeholder-differentiated annual carbon footprint, and contextualization of total carbon footprint and carbon emissions intensity of stakeholder operations. The analysis of those aspects of operation would form a benchmark for assessing the impact of future members, and the aggregate and dissected carbon footprints were to be communicated in easily understandable terms. The results of this research were intended to serve as a diagnostic tool to help mitigate future carbon emissions.
Boundaries were defined in consultation with ENGINEER Management and involved two key-decision making areas, activities to be included and stakeholders to be considered. See previous blog post for discussion of protocols followed. More attention is paid to activities that are defined as ‘Key Source Categories, which are defined as those whose collective contribution account for 95% of the total footprint (when added incrementally in order of decreasing contribution). Activity boundaries categorized as Scope 1, 2, and 3 can be found in Table 1 on page 8 of the original report. Stakeholder boundaries were determined through consultation with the Client, and the results are displayed in the table below:
The following table presents the extent of LCA incorporated into the Emission Factors selected for the Carbon Footprint calculation.
Methodology:
Activity data was collected through periodic meetings with ENGINEER CORE representatives. Questionnaires were used to define relevant stakeholder groups and activities as well as to create an “activity vs. stakeholder mapping.” Electricity, water, and fuel consumption data was obtained from the previous year’s data to begin developing a pre-event estimate. To collect visitor travel activity data, detailed quantitative audience research was conducted to measure emissions, with a sample size of 10% of the expected audience being selected at random to answer a questionnaire.
Activities included within the footprint boundary were further differentiated into multiple activity sub-types. The results are displayed in table 4 on page 13 of the original report. Activity data was then multiplied by the appropriate GHG Emissions Factors developed for India, displayed in Appendix B of the same report.
Results:
The following table presents the extrapolated aggregated resource consumption inventory for ENGINEER 2010.
The total Carbon Footprint of ENGINEER 2010 for the activities presented in the first table and the stakeholders in the second is estimated to be 29.3 tons of CO2e. The following table and figure present the contributions to this total footprint differentiated across all activity groups.
As demonstrated here, travel and logistics was the largest contributor (11.2 tons CO2e–38.4%), and electricity was the second largest (9.6 tons CO2e–32.8%). Food, beverage, and waste was a distant third (4.4 tons CO2e–14.9%).
The following table and figure present the stakeholder contributions to the Carbon Footprint of all activities included within the footprint boundary.
The largest contribution is from activities related to the ENGINEER CORE (9.7 tons CO2e–33.0%).
For discussion of assumptions, data gaps, and limitations, read the original report.
Conclusion:
The Carbon Footprint estimate of 29.3 tons CO2e to serve a participant and visitor base of 4,233 persons leads to a per-participant served Carbon Footprint of approximately 6.9 kg CO2e. It must be noted, however, that the carbon efficiency of the participant stakeholder group is very high due to their use of mass transit systems and low reliance on private vehicular transport to the event. Moreover, guest accommodation was handled using in-house facilities. The elimination of luxury hotel accommodations had a drastic impact on the Carbon Footprint, as the arrangement allows for energy efficiency control and monitoring within the event premises that leads to much greater efficiency than is seen in the luxury hospitality industry in India.
In order to optimize resource and energy consumption, a few measures were recommended in the original report: Indoor temperatures can be raised by two degrees Celsius, lights can be switched off two hours per week, and home composting systems can be used for the disposal of biodegradable waste.
Bibo Water commissioned Vivek Gilani of cBalance to conduct a GHG inventory of their operations. The results are displayed in this blog post.
Project Scope
Activity Boundaries:
The following tables lists activities that were mapped as part of the inventory project and their scope:
Life cycle Boundaries:
While many activities resulted in direct emissions (Scope 1), some resulted in indirect emissions through the generation of electricity (Scope 2), and the emissions caused by the production of goods used (Scope 3) must be included as well in a GHG inventory. The emissions of the latter group were calculated using the life cycle assessment.
Stakeholder Boundaries:
Bibo Water’s physical and operational boundaries were mapped to develop a list of relevant stakeholders (internal process groups) and include their activities (i.e. direct emissions from within the boundary as well as the consumption of goods and services produced elsewhere) as part of the GHG inventory. These boundaries are summarized in the table below:
Resources
Resource Consumption Inventory:
Activity data was collected in order to record the consumption of resources for the months of December 2008, February 2009, and May 2009 and was then extrapolated linearly for an 12 month period.
GHG Inventory and Analysis:
A customized carbon ERP model was developed specifically for the project, and using the appropriate GHG emission factors, a GHG inventory was calculated. The following table summarizes the results:
The pie chart below categorizes the total carbon footprint by activity. Electricity consumption for plant production and administrative activities had by far the greatest impact, followed by emissions from distribution logistics and Scope 3 emissions from plastic use for product packaging.
The next pie chart breaks down the total carbon footprint by stakeholder (i.e. internal process groups in this project) contribution. The internal processes resulting in the greatest impact in terms of absolute magnitude (proportional to quantity of water production) were the production facility at Marvel, followed by Sangareddy and Vandana.
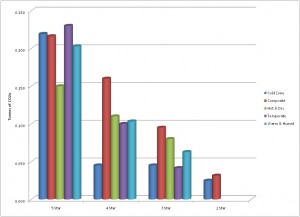
The GHG intensity of production across the various facilities and product lines was also analyzed. The results are displayed in the graph below. Retail production below 2 liter capacity bottles resulted in a significantly higher GHG intensity compared to the bulk production facilities/processes. Amongst the retail units, the Marvel 1 liter production line resulted in the lowest GHG intensity per liter (0.08 kg CO2e/liter) while the highest was the retail production of 300 ml bottles at Marvel. In terms of bulk production, the most efficient production unit was the 20 L production system at Sangareddy (0.005 kgCO2e/liter). The primary reason for the lower GHG intensity of retail vs. bulk units was the re-use of packaging in the case of bulk jars versus single-use PET bottles for retail packaging.
A corresponding trend, mirroring the trend of GHG intensity of Retail Production (below 2 liter capacity bottles) relative to the bulk production facilities/processes, was observed in the context of GHG intensity of logistics operations; logistics for retail units exhibited significantly greater GHG intensity compared to bulk units. The primary reason for the lower GHG intensity of logistics for retail vs. bulk logistics is the smaller network coverage (within the urban center) of the bulk operations relative to the state-wide logistics operations involved in the case of retail units. Furthermore, fuel efficiency of vehicle types used for the retail versus bulk lines had a significant impact on the consequent GHG intensity of logistics operations. The results are shown in the graph below.
The following two graphs show the carbon footprint of the different product lines broken down by activity group.
Schneider Electric Pvt. Ltd. commissioned cBalance to prepare a report showcasing the total carbon footprint of ‘Xperience Efficiency Yatra-2013,’ an event held across 44 cities that demonstrated how new energy technologies can change our lives and was attended by 11,792 customers and 3,422 Schneider Electric employees. The greenhouse gases (GHG) inventory was calculated using the sample data of 11 cities provided by Schneider Electric and generalizing for all 44 cities and accounted for the three major greenhouse gases: carbon dioxide (CO2), methane (CH4), and nitrous oxide (N2O). It was calculated according to the standards laid down in the GHG Protocol.
In the case of this report, the operational boundary for the GHG inventory was defined as:
Research Methodology
The research methodology consisted of the following steps:
Design questionnaire
Data collection
Data verification
GHG inventory calculations
Daya analysis
Reporting
Data
Data was obtained through a questionnaire designed by cBalance and collected by the Schneider Electric Marcom team at two levels: central and venue.
Central level data came from the back office of the Marcom team and included information such as hotel accommodations, communication materials, and air, rail, and bus travel of Schneider Electric employees, etc. It was available for all the 44 city events and the GHG emissions of these activities are, thus, calculated for all of them.
Venue level data was collected at the venues with the hotel staff as respondents. A universally applicable sample of 11 cities’ data was analyzed at the venue level.
cBalance used Footprint Reporter (FPR) to calculate GHG emissions, with the Footprint Report Emission Factor Database (EFDB) used as background data.
Electricity consumption:
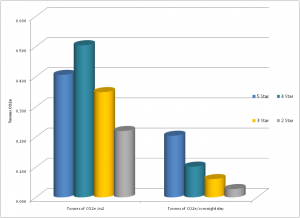
Electricity consumption was calculated by using the number of hours the floor space of the venue was used for the event, with predefined electricity usage per square meter for 3 star, 4 star, and 5 star facilities being used for the analysis. It’s assumed that each session is 4.5 hours long (3 for assembly and 1.5 for disantling) and that events take place for 15 days in a month with an average of 8 hours per event.
Air travel:
Air travel activity data was calculated by estimating average passenger-km per flight (modeling that single flight by short, medium, and long haul type in FPR) and multiplying the footprint of each flight type by the total quantity of landings/take-offs (including stopovers), including circling-inefficiency (for domestic travel), per flight type. Short haul distances are defined to be between 0 to 694.5 km, Medium Haul distances defined as 995 to 1,620.5 km, and Long Haul distances are defined as 1,621 to 2,778 kms.
City travel and intercity travel of attendees:
The intercity travel of the attendees was considered to be 10% of the total attendees, with the other 90% traveling within the city. It was calculated for all modes of transport using the same data of city and intercity travel and was then estimated for the grand total attendees for all the events.
Accommodation:
Total overnight stay of employees of Schneider Electric in 3 star, 4 star, and 5 star facilities in different climatic zones (i.e. warm and humid, hot and dry, temperate) was computed and then modeled in FPR.
Food and Beverage:
It was assumed that every attendee consumed a liter of water at the event, and the emission per meal served was considered to be 0.855 kgCO2e.
Other activity data:
This included fuel consumption for diesel generator, heavy motor vehicles used in the logistics of the event, train and bus travel of Schneider Electric employees, and the total weight of recycled bags and brochures used.
Results
Scope 1, 2, 3 GHG Emissions:
As shown by the table and chart below, Scope 3 emissions were the largest contributor, at 57.8%, and Scope 1 emissions were the second largest, at 28.8%.
Scope 1 GHG emissions:
Heavy motorized vehicles used for event logistics were far and away the largest source of Scope 1 emissions, as is evident from the table and chart below.
Scope 2 emissions:
As demonstrated by the following table, all Scope 2 emissions are the consequence of electricity use. In terms of total magnitude, these emissions have a relatively low impact on the total GHG emissions as the events are not energy intensive and do not rely upon electrically powered machines or processes. These emissions consist of both- electricity purchased and AT&C losses.
Scope 3 emissions:
The table and chart below make it clear that accommodation was the largest source of Scope 3 emissions, followed by intercity travel.
Activity category-wise emissions:
Breaking down the emissions by activity gives us a different perspective from which to view the event’s carbon footprint. Accommodation was the single largest contributor to activity category-wise emissions, with 31.4 % of total GHG emissions, followed by logistics (24.0%). Intercity travel and purchased electricity consumption were also significant, at 15.7% and 13.4%, respectively. The rest were rather minor contributors.
Conclusion
This illustrates the total Carbon Footprint Summary of all the 44 city events as well as an average representing that for each city event. Total GHG emissions for all 44 city events amount to 388.384 Tonnes of CO2e, while GHG emissions per city event are 8.827 Tonnes of CO2e.
This article is a simple “sustainability guide for the hospitality sector in India”. It will give an overview of the methods that can be taken by a hotel to chart a performance based sustainable growth path.
While a lot of hotels are taking positive measures to become environmentally friendly most of them are ad-hoc steps undertaken without any long term plan and data to substantiate the investment thus preventing hotels from being able to fully leverage their benefits. The main objective of these exercises is to be visible to the customers and project themselves as a green brand. This has led to “greenwashing” becoming a norm in the industry. Greenwashing can be defined as “The act of misleading consumers regarding the environmental practices of a company or the environmental benefits of a product or service”. The trap of greenwashing may enable firms to get short term returns on small investments but with a constant evolution of the knowledge base among customers, it compromises the integrity and the long term sustainability of the brand
Over time, green practices in the hospitality industry will become a baseline requirement, HCMI stands for Hotel Carbon Measurement initiative and is an effort to unite the hotel industry in order to calculate and communicate carbon emissions from guest rooms and meeting space in a uniform way. It is a simple method, available free of cost and a great starting point for any hotel looking to wet its toes on the path towards sustainability. It was developed by industry, for industry and will help customers especially corporate customers get accurate and consistent carbon footprint information from hotels globally. It is being pioneered by The International Tourism Partnership, World Travel & Tourism Council and 23 global hotel companies including well know ones such as Hyatt, Marriott, Hilton etc. It requires hotels to report emissions from only three key sectors which make up a bulk of the emissions namely: Fuel, Electricity and Outsourced Laundry. This will enable conscious individuals and companies to compare the basic sustainability of hotels globally and make informed decisions on how to spend their money; particularly as the cost of non-renewable energy continues to rise, regulatory pressure increases, and consumers become more demanding. Therefore, hotels with business models that revolve around green practices will have the strongest opportunity to achieve a competitive advantage by being ahead of the emerging sustainability curve. It would need hotels to move from a standard practice of proclaiming sustainability through words to a holistic approach that quantifies and certifies the operational performance of the hotel. As expected the international hospitality industry has taken the lead on this front. While doing so they have realized the benefits of these steps not only as a tool to better their image but one that also has a significant effect on their efficiency and as a result on their bottom line. This has resulted in the laggards in the industry having to pay dearly by spending large amounts of money to retrofit their hotels just to be competitive.
With the investment in India’s travel and tourism sector expected to grow at 8.8 % to INR 2,827.5 billion (US$ 63.7 billion) until 2021 there is a huge opportunity for hotels in India to learn from the industry around the world and invest early in a performance based system of sustainability that will help the hotel continuously improve its efficiency and performance.
The biggest challenge for the sector is that it is fragmented with the exception of a few big players. The smaller hotels are unable to visualize the larger impact of their activities. With limited knowledge and capability to invest in technological interventions it is absolutely necessary for them to accurately calculate the cost and resultant savings of various interventions so as to maximize their ROI. It is also equally important for these hotels to be able to accurately calculate and convey the savings and benefits to potential customers in a quantitative and qualitative manner to enable them to make informed decisions.
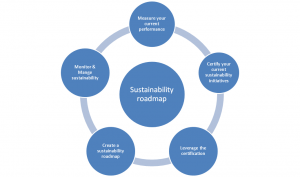
With a vision of enabling all: small & medium to large chain hotels across the country to undertake a wholesome approach to sustainability in a cost effective manner, outlined below is a realm of strategic steps that a hotel can take to put itself on the path to sustainable low carbon development.
Figure 1: The Sustainability roadmap
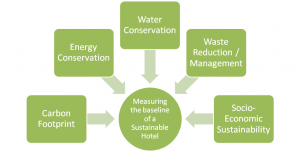
Measure your current performance: This is a process of defining the baseline for your hotel. It will help you see where you are currently placed and accordingly set goals. This does not require a hotel to have taken significant steps towards becoming sustainable. There are several frameworks that help you measure your baseline such as HCMI and The Green Signal Ecolabel.
green signal <Sustainability guide for the hospitality sector in India>
Hotels looking to get deeper into the realm of sustainability there is the Green Signal ecolabel which not only enables a hotel to measure its carbon footprint but also helps it measure sustainability parameters in energy conservation, water conservation, waste reduction and Social economic involvement. The method for measuring the carbon footprint of a hotel is also far more rigorous and includes parameters in Fuel, Electricity, Outsourced Laundry, Water, Waste Water, Corporate travel & F&B. This enables an organization to view its sustainability not only from the perspective of carbon but also from other key parameters like water and waste. Such a holistic study of a hotels sustainability enables it to prioritize areas of focus and set specific targets for improvement.
Certify your sustainability initiatives:. A common way of certification around the world has been in the form of ecolabels or other similar certifications from independent third parties. There exist in India quite a few certifications like LEED, GRIHA, IGBC etc for new development projects as well as a few international ecolabels especially for hotels. These standards are helpful to some extent but they fall short of providing a holistic solution to organizations as they are static, intent and compliance based rather than performance based. These methods advise you on what targets are to be achieved but do not help you select the appropriate interventions specifically for your project that will help you achieve those targets in a cost effective manner. A simple compliance system is not sufficient to accurately measure and convey the savings and the effect of the efficiency and conservation measures undertaken for the project to potential customers. The Green Signal Ecolabel while also providing a framework for sustainability measurement certifies applicants not only based on pre-specified targets but also on their relative performance to their peers in the sector. This is done by benchmarking the performance to specific peers who fall in the same sub groups such as hotel type, agro climatic zone and service grade. This encourages hotels to continually strive for improvement and keep pace with competitors, which improves the overall market stock. A survey conducted by BEE in partnership with USAID the results of which are shown below tells us that an average 5 star hotel can save between Rs.1-5 cr/year and abate between 500 to 5000 tonnes of CO2e/year depending on the agro climatic zone and size if it improves its energy efficiency to be in the Top 25% percentile.
Figure 3: co2 emissions of hotels by service grade
Figure 4: co2 emissions of hotels by service grade
Leverage the certification: After certification, hotels can take advantage of the credibility to reach out to current and potential customers and project themselves as a brand on the path towards sustainability. This includes branding all publicity collateral with the ecolabel, publishing a sustainability report, getting featured and listed on eco friendly travel portals frequented by conscious tourists. Hotels can also get innovative by initiatives such as conveying key performance data to guests in a non invasive manner at the appropriate point of contact such as ‘Our sensor taps save 3500l/year equivalent to 5% of our total water consumption shown in restrooms’, or using department specific data for staff training and internal goal setting. They can also go the extra mile and offer certified carbon neutral holidays to their guests.
Create a sustainability roadmap: Once a hotel has measured its baseline, taken some steps towards sustainability and gotten themselves certified they can opt for a in-depth analysis which will help them chart a short, medium and long term sustainability plan for their organization. Energy, Waste and Water audits can be carried out to assess resource intensive hot spots and deep opportunities for savings that can be harnessed by using eco-friendly alternatives for key products along with appropriate staff training. Innovative tools such as Marginal Green House Gases(GHG) Abatement Cost Curve (MACC) modelling can help prioritize green investments based on growth and investment patterns. MACC analysis is designed to discover the most cost-effective means of mitigating climate change impact by identifying the low-hanging fruit alternatives that must be pursued before embarking upon token or capital-intensive programs. MACC will help maximize tonnes of co2e abated for every Rs. spend and can be hotel or hotel chain specific or even community specific.
Monitor and manage sustainability: Once the opportunities have been identified and targets have been set a hotel will need to track its progress towards these goals. This can be done by empowering an individual or team within the organization to be the champions for change who will monitor and track progress. Cloud based carbon footprinting tools such as Footprint Reporter powered by an India specific emission factor database can also be effective methods to track sustainability projects and automatically generate statistics and reports which can help an organization effectively monitor its progress.
Each of these topics will be taken up in detail in the subsequent editions of this article.
In conclusion it is imperative for the hospitality industry to quickly realize that with increasing choice tourists are getting more discerning and environmentally conscious and are looking for brands with credible differentiators. Despite first-time guests basing their decisions on location, amenities and service, inclusive but non-intrusive sustainability initiatives have been shown to create positive perceptions in guests resulting in a higher recall rate. This results in increased customer loyalty as well as higher brand value of the hotel. To keep attracting tourists especially foreign tourists whose numbers are growing at 7.2% CAGR, hotels need to tap into new customer bases and create differentiators for themselves. Developing a short term and long term performance based sustainability strategy will enable an organization to identify a proactive low-carbon development pathway to be future ready.
For comments or feedback contact me on: udit@cbalance.in ( www.cbalance.in)


")

")

")

, Beer Bottle: Total avoided emission (per piece of beer bottle)")
")