Eliminate Carbon Emissions (ECE) Pvt. Ltd was contracted by the IPL Management upon the recommendation of the United Nations Environment Program (UNEP) to calculate the IPL’s annual carbon footprint (i.e. an inventory of the total greenhouse gas emissions – GHGs – that contribute to climate change, resulting from direct and indirect resource consumption through DLF IPL 2010’s annual operations).
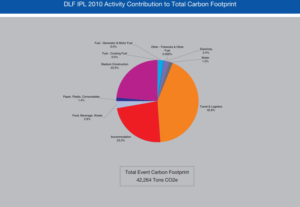
The total carbon footprint of DLF IPL 2010 was estimated to be 42,264 tons CO2e. DLF IPL 2010’s Carbon Footprint can be thought of as requiring 169,055 trees to ‘neutralise’ its impact on climate change over a period of 20 years. This equates to approximately 2,818 trees per match.
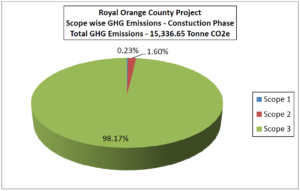
The following activities comprise its carbon Footprint, in order of decreasing magnitude: travel and logistics (18,073 tons CO2e – 42.8%), stadium construction (9,932 tons CO2e – 23.5%), luxury hotel accommodation (9,927 tons CO2e – 23.5%) , food, beverage, and waste (1,201 tons CO2e – 2.8%) and electricity (996 tons CO2e – 2.4%). These results are displayed in the chart below:
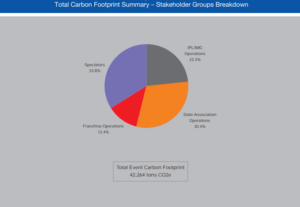
Relative stakeholder contributions to the DLF IPL 2010 Carbon Footprint are: IPL/IMG Operations (9,861 tons CO2e – 23%), state association operations (12,861 tons CO2e – 30%), franchise operations (5,243 tons CO2e – 12%), spectator activities (14,300 tons CO2e – 35%). The following chart displays the results:
A majority of the carbon footprint of DLF IPL 2010 is the consequence of activities related to its contractors, while only 23% of the footprint is a direct consequence of direct IPL/IMG managed operations. It is imperative that footprint mitigation strategies account for this aspect of footprint distribution.
Spectators are the most significant stakeholders in terms of contribution to total carbon footprint. Private vehicular travel is the single largest contributing factor – responsible for 6,517 tons CO2e (45%) of the stadium spectator carbon footprint. It is imperative to address this disproportionately heavy reliance on private transport consumed for spectator travel when addressing the overall IPL carbon footprint.
TV viewership-related carbon footprint for DLF IPL 2010 was 358,039 tons CO2e and far outweighed the contributions of any other stakeholder or activity considered within the IPL carbon footprint boundary. This component of carbon footprint, and its root cause–large quantity of consumption of electricity through TV sets–needs to be addressed with greater emphasis on its analysis and mitigation through innovative strategies and interventions in future editions of the IPL.
The impact of stadium construction, one of the primary activities contributing significantly to the IPL footprint, needs to be mitigated by intervening and exploiting opportunities to infuse low-carbon and green architecture and construction practices as the cornerstone of future stadium construction activities at proposed stadiums that are intended for use by the IPL.
Best practice examples for a majority of stakeholder functions within the IPL have been identified and quantified and their initial feasibility assessed. Best practice benchmark replication across the IPL must be pursued as a potent and actionable strategy for optimizing the carbon footprint of the IPL prior to any resource and capital-intensive carbon footprint minimisation strategies.
All interventions must be accompanied by effective communication to all internal and external stakeholders. They must also be in consonance with a well thought-out greening strategy that aims not just at a carbon neutral IPL but sets itself the loftier target of an IPL that is a net carbon sink (an indicative road map is presented in Appendix H of the original report).
Best practice incentivisation through formal programs and its incorporation into contractual negotiations processes with all vendors, contractors and other relevant stakeholders is ascertained to be the most feasible ‘first step’ on the pathway to drastically reducing the carbon footprint of IPL in the forthcoming seasons. Central IPL support and nurturing of competitive franchise behavior through formal recognition of the ‘lowest carbon footprint’ or ‘greenest’ franchise is one illustrative example that may be expanded to envelop all aspects of IPL operations in future editions.
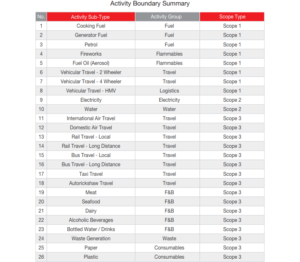
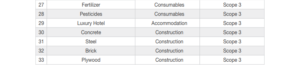
The carbon footprint determined as part of this project phase does not account for the entire life-cycle of the resources consumed and their comprehensive impact on Climate Change and ecology. Accounting for resource acquisition, processing, and disposal impacts could magnify the current extent manifold. A life-cycle analysis (LCA) of all primary resources consumed is essential to ascertain a more comprehensive carbon footprint that tends towards the true climate change impact of IPL. It is recommended that IPL 2011 be assessed on a LCA basis and that preparatory work for an LCA study be commissioned as part of the next phase of the project. The activity boundaries are outlined in the following table:
It is recommended that the IPL commission ECE to commence a comprehensive carbon footprint minimization analysis as part of a long-term ‘greening program’ (in fulfillment of its MOU with the UNEP’s Sports and Environment Unit) to identify means and alternatives for optimising and minimising its resource intensiveness.
Prior to minimising and offsetting the impact of future IPLs, it is recommended that the IPL commit to neutralise the impact of, as minimum, the four knock-out phase matches of DLF IPL 2010 (estimated to be 3,148 tons). While multiple options for offsetting are available in the conventional Carbon Offset market, the alternatives that result in equitable distribution of benefits to the grassroots stakeholder communities who are imperative to the project’s implementation are preferred as a more potent agent of social and environmental transformation.
The Orange County Foundation is a group of individuals who have experience in eco-friendly architecture and civil construction, and focus on sustainable urban development. The foundation has developed a self-sufficient green housing project at Pashan, Pune–the first of its kind–and is developing another green housing project, ‘Royal Orange County’ (ROC), at Rahatani Pune. This project involves eight multi-storied buildings, consisting a total of 353 residential flats. The ROC has adopted a number of sustainable and environment-friendly options, such as eco friendly architectural design buildings, renewable energy, waste management, wastewater management and low-carbon embodied construction and building materials.
Project Objectives:
Internal capacity building and skill development for the Orange County Foundation team to calculate the carbon footprint of their construction projects
License of authenticated database for India specific emission factors related to construction and building materials, electricity & energy, mobility, AFLOU, waste, and wastewater to map the environmental performance and sustainability impact of the Orange County Foundation’s projects
Life-cycle process mapping of the ROC construction to develop a toolkit for carbon ERP integration into their system
Carbon Footprinting of the design and construction phase of the ROC project
cBalance’s Roles:
Annual Enterprise-Use License for cBalance Carbon Emission Factor Database (CEFD) – cBalance authorized yearly subscription of the CEFD tool to the Orange County Foundation to map the carbon footprint of projects using India-specific emission factors of construction and building materials, energy, mobility, AFLOU, waste and wastewater.
Training to Orange County Foundation Team for Assessment of Carbon Footprint – cBalance team provided 16 hours extensive training to the Orange County Foundation team on the topic of carbon footprinting, life-cycle of a construction project and introduction to common carbon metrics for building operations. In addition, cBalance provided training on the CEFD tool and instructed how the CEFD can be helpful to choose sustainable and low-carbon activity or material alternatives.
Life-cycle Process Mapping and Toolkit Development for Carbon Footprint – The cBalance team visited the construction site and project office of the ROC. Through a site audit and interviews with project officers, cBalance mapped the activities related to the design and construction phase of the ROC. Thereafter, cBalance developed a toolkit that integrated into their existing system for mapping the life-cycle carbon footprint of the ROC and future projects.
Carbon Footprinting of Royal Orange County Residential Housing Project – The cBalance team collected data from the ROC on deforestation, electricity, fuels, and construction and building materials consumption of the construction phase of the ROC and calculated the construction phase carbon footprint using India-specific GHG emission factors. Finally, the cBalance team presented the carbon footprint analysis to the board of the Orange County Foundation.
Results:
Subscription to the CEFD and in-person training empowered Orange County Foundation team to:
calculate the carbon footprint of their projects using India-specific GHG emission factors
assess life-cycle environmental performance and sustainable impact of their projects
choose sustainable alternatives over conventional construction and building material
compare environmental performances of two different construction projects
create a baseline and frame future strategies to reduce the carbon footprint
The Orange County Foundation team calculated the carbon footprint of the ROC construction phase and successfully achieved a 15% reduction in GHG emissions compared with previous projects.
The above graph demonstrates this 15% reduction. Below, the GHG emissions from the construction phase categorized by scope are displayed. As is obvious, almost all of the emissions were Scope 3.
This blog post summarizes the carbon footprint calculation conducted by Eliminate Carbon Emissions Pvt. Ltd to measure the greenhouse gas emissions of the Neemrana Fort Palace Hotel (pictured below).
Goals and Scope:
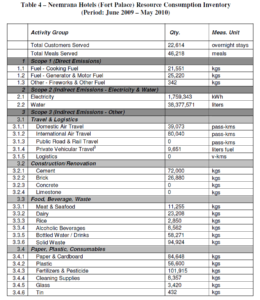
The project goals were to determine with the great degree of accuracy possible the total resource consumption inventory, total carbon footprint, and the activity-differentiated carbon footprint of the Neemrana Fort Palace Hotel’s operations. The activity boundaries were categorized as Scope 1, 2, and 3 emissions, with the results displayed in the following table.
The stakeholders were defined as the primary realizer (Neemrana Fort) and the fruit jam production facility (Nainital). While many activities resulted in direct emissions (Scope 1), some resulted in indirect emissions through the generation of electricity (Scope 2), and the emissions caused by the production of goods used (Scope 3) must be included as well in a GHG inventory. The emissions of the latter group were calculated using the life cycle assessment.
Results:
The following table presents the extrapolated aggregated resource consumption inventory for the Neemrana Fort Palace Hotel.
This resource consumption resulted in a total of 3,282 tons CO2e of 0.145 tons CO2e per stay from the period of June 2009 to May 2010. The results, categorized by activity, are displayed below.
As is obvious from the results, the vast majority of the greenhouse gas emissions came from the generation of electricity (83.5%). While nothing else came close, the GHG emissions from water (2.3%), generator usage (2.5%) and meat and seafood (2.6%) were also significant. Food, beverage, and waste as a category contributed 6.2% of the total emissions. The same results are displayed in the pie chart below.
Conclusion:
With electricity generation being responsible for so much of the hotel’s GHG emissions, efforts to reduce these emissions should focus on reducing electricity consumption. Staff and guests can work together to use less electricity through a number of voluntary (or mandatory) measures.
Bibo Water commissioned Vivek Gilani of cBalance to conduct a GHG inventory of their operations. The results are displayed in this blog post.
Project Scope
Activity Boundaries:
The following tables lists activities that were mapped as part of the inventory project and their scope:
Life cycle Boundaries:
While many activities resulted in direct emissions (Scope 1), some resulted in indirect emissions through the generation of electricity (Scope 2), and the emissions caused by the production of goods used (Scope 3) must be included as well in a GHG inventory. The emissions of the latter group were calculated using the life cycle assessment.
Stakeholder Boundaries:
Bibo Water’s physical and operational boundaries were mapped to develop a list of relevant stakeholders (internal process groups) and include their activities (i.e. direct emissions from within the boundary as well as the consumption of goods and services produced elsewhere) as part of the GHG inventory. These boundaries are summarized in the table below:
Resources
Resource Consumption Inventory:
Activity data was collected in order to record the consumption of resources for the months of December 2008, February 2009, and May 2009 and was then extrapolated linearly for an 12 month period.
GHG Inventory and Analysis:
A customized carbon ERP model was developed specifically for the project, and using the appropriate GHG emission factors, a GHG inventory was calculated. The following table summarizes the results:
The pie chart below categorizes the total carbon footprint by activity. Electricity consumption for plant production and administrative activities had by far the greatest impact, followed by emissions from distribution logistics and Scope 3 emissions from plastic use for product packaging.
The next pie chart breaks down the total carbon footprint by stakeholder (i.e. internal process groups in this project) contribution. The internal processes resulting in the greatest impact in terms of absolute magnitude (proportional to quantity of water production) were the production facility at Marvel, followed by Sangareddy and Vandana.
The GHG intensity of production across the various facilities and product lines was also analyzed. The results are displayed in the graph below. Retail production below 2 liter capacity bottles resulted in a significantly higher GHG intensity compared to the bulk production facilities/processes. Amongst the retail units, the Marvel 1 liter production line resulted in the lowest GHG intensity per liter (0.08 kg CO2e/liter) while the highest was the retail production of 300 ml bottles at Marvel. In terms of bulk production, the most efficient production unit was the 20 L production system at Sangareddy (0.005 kgCO2e/liter). The primary reason for the lower GHG intensity of retail vs. bulk units was the re-use of packaging in the case of bulk jars versus single-use PET bottles for retail packaging.
A corresponding trend, mirroring the trend of GHG intensity of Retail Production (below 2 liter capacity bottles) relative to the bulk production facilities/processes, was observed in the context of GHG intensity of logistics operations; logistics for retail units exhibited significantly greater GHG intensity compared to bulk units. The primary reason for the lower GHG intensity of logistics for retail vs. bulk logistics is the smaller network coverage (within the urban center) of the bulk operations relative to the state-wide logistics operations involved in the case of retail units. Furthermore, fuel efficiency of vehicle types used for the retail versus bulk lines had a significant impact on the consequent GHG intensity of logistics operations. The results are shown in the graph below.
The following two graphs show the carbon footprint of the different product lines broken down by activity group.
INTRODUCTION TO CARBON EMISSIONS IN THE CEMENT SECTOR IN INDIA:
Cement as a commodity plays a vital role in the growth of a nation since it is an essential raw material for concrete which is a key raw material in key sectors like infrastructure, construction, commercial and residential real estate. Globally, cement contributes about 5% of the total CO2 emissions. Concrete is the second most consumed substance on Earth after water. On average, each year, three tons of concrete are consumed by every person on the planet. In India, the cement sector is one of the prominent contributors to conventional as well as GHG emissions. Although there is no statutory obligation on companies to measure and report total air emissions in India, the preparation of air emission inventories can be useful in internal company benchmarking, public reporting, product profiles, and emerging emissions trading. In the near future, it is also possible that such inventories will encourage voluntary actions to promote energy efficiency and GHG emissions mitigations, especially in large, organized industrial sectors like cement
INDIAN CEMENT SECTOR AT A GLANCE:
India stands second in the cement production in world after China. The total installed capacity of India in 2009-10 was 236 MT in 2009–2010. In same year the cement production for India was 200.7 MT.
PROCESS DESCRIPTION:
Carbon dioxide (CO2) is emitted from both the chemical process and energy consumption associated with the manufacturing of cement. During calcination or calcining, calcium carbonate (CaCO3)(limestone) is heated in a cement kiln to form lime, a process that emits CO2 as a byproduct. This accounts for about 50% of all emissions from cement production. The resulting lime reacts in the kiln with silica, aluminum, and iron oxides present in the raw material to produce clinker. Clinker, an intermediate product, is mixed with a small amount of gypsum and/or anhydrite to make Portland cement. Indirect emissions from the burning of fossil fuels used to heat the kiln account for about 40% of emissions from cement. Finally, electricity used to power additional machinery and the transportation of cement account for the remaining 5-10% of the industry’s emissions. (Rubenstein)
SCOPE AND METHODOLOGY FOR CEMENT SECTOR INVENTORY:-
SCOPE
For this study 51 cement producing Indian companies have been analyzed. ‘Carbon emissions in the Cement sector in India’ have been calculated per ton of cement produced by each company from data available in their annual reports using the process shown in the diagram below. Emissions per ton of cement produced is known as the emission intensity of the company or also referred to as the emission factor. The following Scope 1, Scope 2 and Scope 3 activities as defined are taken into consideration.
FORMULA
Emission factor (TCO2e/Ton cement produced) = Total emissions in FY / Total amount of cement produced in FY
METHODOLOGY
Energy fuels comprise of various fossil fuels, wood, municipal waste, peat fuels.
Electricity purchased is the quantity of electricity purchased by a company from the grid.
Captive power generation is the self generation of electricity for meeting internal requirements. A company can produce electricity through various technologies like diesel generator, gas generator, steam generator etc. Depending on the technology and the fossil fuel used emissions from captive power generation is calculated.
In cases where company specific captive generation emission factors are not available an India average for that particular technology has been used
Non energy emissions are emissions resulting from the chemical processing of certain materials such as limestone and is obtained from one of the following sources of data as per the IPCC/GHG Protocol guidelines : clinker production, limestone production and cement production
Emissions from Raw material purchased include Scope 3 emissions which are attributed to a company when either limestone or clinker is purchased for use as a raw material in cement manufacturing.
RESULTS:
Company Name
Actual Production in ‘000 Tons
Total CO2e in ‘000 tonnes
TCO2e/ton cement production
Percentage intensity related to India Average Emission factor
A C C
Ltd.
21369.00
17522.58
0.82
0.96
Ambuja Cements Ltd.
18828.45
13368.20
0.71
0.83
Andhra Cements Ltd.
990.94
693.66
0.7
0.82
Anjani Portland Cement Ltd.
497.72
408.13
0.82
0.96
Barak Valley Cements Ltd.
207.92
176.73
0.85
1.00
Bheema Cements Ltd.
251.60
183.67
0.73
0.85
Binani Cement Ltd.
5280.00
4012.80
0.76
0.89
Birla Corporation Ltd.
5698.00
4615.38
0.81
0.95
Burnpur Cement Ltd.
74.92
39.71
0.53
0.62
Cement Corpn. Of India Ltd.
968.23
1103.78
1.14
1.33
Cement International Ltd.
78.73
37.79
0.48
0.56
Cement Manufacturing Co. Ltd.
401.41
622.19
1.55
1.81
Century Textiles & Inds. Ltd.
7583.22
7507.38
0.99
1.16
Chettinad Cement Corpn. Ltd.
4003.47
2882.50
0.72
0.84
Cochin Cements Ltd.
58.52
26.92
0.46
0.54
Dalmia
cement (Bharat) Ltd.
4074.00
3585.12
0.88
1.03
Deccan Cements Ltd.
1096.95
1217.61
1.11
1.30
Gujarat Sidhee Cement Ltd.
2034.19
2196.93
1.08
1.26
Heidelberg Cement India Ltd.
2660.67
1676.22
0.63
0.74
Hemadri Cements Ltd.
203.64
238.26
1.17
1.37
India Cements Ltd.
10494.00
8710.02
0.83
0.97
J K Cement Ltd.
4586.51
4540.64
0.99
1.16
J K Lakshmi Cement Ltd.
4156.76
3283.84
0.79
0.92
K C P Ltd.
807.65
654.19
0.81
0.95
Kakatiya Cement Sugar & Inds. Ltd.
258.86
308.05
1.19
1.39
Kalyanpur Cements Ltd.
676.00
594.88
0.88
1.03
Keerthi Industries Ltd.
280.11
296.91
1.06
1.24
Lafarge India Pvt. Ltd.
7851.20
4789.23
0.61
0.71
Madras Cements Ltd.
8030.00
6343.70
0.79
0.92
Mangalam Cement Ltd.
1637.00
1718.85
1.05
1.23
Meghalaya Cement Ltd.
555.98
489.26
0.88
1.03
My Home Inds. Ltd.
2984.34
2327.79
0.78
0.91
N C L Industries Ltd.
590.14
714.07
1.21
1.42
O C L India Ltd.
3035.00
1821.00
0.6
0.70
Orient Paper & Inds. Ltd.
3056.03
2750.43
0.9
1.05
Panyam Cements & Mineral Inds. Ltd.
433.03
506.65
1.17
1.37
Penna Cement Inds. Ltd.
4088.77
3679.89
0.9
1.05
Prism Cement Ltd.
2568.32
2439.90
0.95
1.11
Rain Commodities Ltd.
2372.30
1992.73
0.84
0.98
Rishi Cement Co. Ltd.
1.74
2.92
1.68
1.97
Sagar Cements Ltd.
1120.35
1557.29
1.39
1.63
Sainik Finance & Inds. Ltd.
37.61
32.72
0.87
1.02
Samruddhi Cement Ltd. [Merged]
10121.95
10020.73
0.99
1.16
Sanghi Industries Ltd.
1828.17
1919.58
1.05
1.23
Saurashtra Cement Ltd.
1285.92
1337.35
1.04
1.22
Shiva Cement
Ltd.
98.47
88.62
0.9
1.05
Shree Cement Ltd.
9371.92
7684.97
0.82
0.96
Shree Digvijay Cement Co. Ltd.
1010.66
899.49
0.89
1.04
Ultratech Cement Ltd.
17639.00
17991.78
1.02
1.19
Vinay Cements Ltd.
97.69
137.74
1.41
1.65
Zuari Cement Ltd.
3195.20
2556.16
0.8
0.94
Sum
180632.25
154306.96
0.85
ANALYSIS OF CARBON EMISSIONS IN THE CEMENT SECTOR IN INDIA:
The graph below shows us the emissions per ton of cement produced for each company as well as the emission intensity of the various companies as compared to the India average of 0.85 TCO2e/ ton of cement produced. We can see that about 55% of the companies i.e. 28 out of 51 have emission intensities higher than the India average. Cochin Cement Ltd. has the lowest emission factor of 0.46 TCO2e/ton while the company with the highest factor is Rishi Cement Ltd. at 2.92 TCO2e/Ton cement. The range of the intensity with respect to the average varies from 0.54 of Cochin Cement Ltd. to 1.97 of Rishi Cement Ltd.
Figure 1: Emission intensities of companies in the cement sector in India
DISTRIBUTION OF GHG INTENSITIES OF COMPANIES IN THE SECTOR:-
The distribution of emission intensities of the companies analyzed is shown below:
Figure 2: Distribution of emission intensities of companies in the cement sector in India
As visible in the graph above about half of the 51 companies have emission intensities in the medium range. There is quite an even distribution of companies with about a quarter in the above average range and a quarter in the below average range. The 12% of companies in the first bar can be termed as sector leader and set the benchmark for the rest of the industry. Second bar are above average but need some process related interventions to improve efficiency. The laggards are companies in need of major technology advances to improve efficiency and reduce emissions. Such a chart can help policy makers design specific policy initiatives to cater to companies in each range as well provide prioritize incentives based on the quantum of distribution.
METHODS FOR CARBON MITIGATION IN THE CEMENT INDUSTRY:-
Indirect emissions from burning fossil fuels to heat the kiln can be reduced by switching to such as natural gas, biomass and waste-derived fuels. These less carbon-intensive fuels could help reduce almost a quarter of overall cement emissions from 2006 levels by 2050.
Increasing efficiency of the production process so as to reduce the demand for fuel through technical and mechanical improvements will also help drastically reduce emissions. Steps such as switching from inefficienct wet ils to dry ones or regular preventive maintenance could help achieve emission reductions of upto 40%.
Reducing emissions from the calcination process means looking for an alternative to limestone. Blended cement made up primarily of coal fly ash and blast furnace slag replaces some of the limestone-based clinker with other materials. This could help reduce CO2 emissions by as much as 20%, but widespread use of blended cement is limited by other environmental regulations as these substitutes can contain toxic heavy metals; the limited availability of substitute material; as well as some building code restrictions since blended cement can take longer to set.
The final method of containing CO2 emissions is after they are produced through carbon capture and storage. In addition to traditional CCS methods, which are already employed in some power plants around the world, concrete producers can explore using their own product as a sink for CO2. Through the process of accelerated carbonation, CO2 penetrates concrete and reacts with calcium hydroxide in the presence of water to form calcium carbonate; the result is stable, long-term CO2 storage. As a mitigation technology, accelerated carbonation can be achieved by exposing freshly mixed concrete to flue gases with high CO2 concentrations. (Rubenstein)
CONCLUSION:-
There are 28 companies out of 51 in the cement sector whose emission factor is more than the India average per ton produced. If all of these companies improve their efficiency using the various methods mentioned above, to atleast the Indian average there will be a savings of upto 10.41 Million TCO2e. In a potential best case scenario, if all the other 50 companies perform atleast as well as the best in class, i.e Cochin Cement ltd. which has an emission intensity of 0.46 TCO2e/ton of cement produced, approximately 71.21 Million TCO2e can be saved. Such sector specific and company specific understanding of GHG intensities can be a useful tool for policy making in order to frame direct and target based incentives which will be necessary if India is to achieve its goal of 20-25% emission reduction over 2005 levels by 2020.
GLOSSARY
1) Scope 1: Direct air emissions from sources that are owned or controlled by the company These include direct process emissions (e.g. calcination of raw materials), direct stationary combustion in furnaces, diesel generator sets, etc., from fossil fuels, and mobile emissions from company-owned vehicles.
2) Scope 2: Indirect air emissions from the generation of purchased electricity consumed by the company 3) Scope 3: Other indirect air emissions from sources not owned or controlled by the facility like extraction and production of purchased materials, transportation of purchased fuels, clinker imports, and use of sold products and services
REFERENCES
(The Energy and Resources Institute (TERI),USEPA, 2005 • http://www.ibef.org/download/Cement_270111.pdf
http://www.ibef.org/download/Cement_270111.pdf
Calculating CO2 process emissions from Cement Production (Cement-based Methodology), Guide to calculation worksheet (October 2001) • Rubenstein, Madeleine – http://blogs.ei.columbia.edu/