

Coal Efficiency and GHG Intensity Enhancement Potential for the Steel Sector in India
Posted OnThis blog post discusses the results of a report written in 2011 by Vivek Gilani and Dr. Amit Garg on the subject of the potential for improving the coal efficiency and GHG intensity of the steel sector in India.
Facts:
The domestic cola production target for 2011-12 was 554 mt. India added 1660 MW generation capacity in July of 2011 (all thermal power), and Indian plants exceeded their power generation target that month. Additionally, Coal India Ltd (CIL) reported a 64.06% rise in profit after tax (PAT) during the first quarter (April-June) of 2011-12.
India’s coal import in 2011-12 was predicted to be 137.03 mt, with some ports seeing huge increases in the amount of incoming imported coal. The import of coking coal through Paradip port on the eastern coast of India increased from 258,479 in June 2011 to 668,574 in July, an increase of 410,095 tons, or 159%. Imports of PCI coal through Vizag port in July 2011 stood at 113,467 tons, 86,764 tons more than the 26,703 tons imported in June 2011. And the imports of Low Ash Metallurgical (LAM) coke through Paradip port in the month of July 2011 rose sharply to 60,590 tons, compared with 6,000 tons in June 2011
Domestic mining has many environmental impacts, including the issue of land usage. 171 coal mining proposals involving 28,862 hectares of forest land are awaiting forestry clearance as of June 30, 2011. 44 projects of Coal India Ltd (CIL) stuck under Comprehensive Environment Pollution India (CEPI) norms introduced b they MoEF.
Question:
Can the most efficient users of coal in India’s steel sector help India:
- increase its energy independence
- meet its climate change commitments
- and even save some forests?
Trends:
The following chart displays the GHG intensity of production in the Indian steel sector.

As is evident from the results, coking coal is the largest contributor at 40%, with coal being the second largest at 26%. Steam turbines and grid electricity, at 12%, were also significant.
The following table describes the GHG intensity of production in various steel companies throughout the sector.

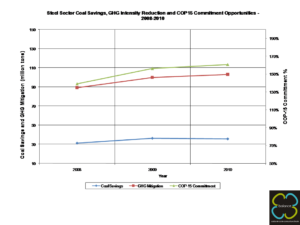
The following table, on the other hand, depicts the coal efficiency and GHG intensity enhancement of Indian steel companies. In the years 2008-2010, they substantially exceeded their COP15 commitments regarding GHG mitigation.
 The following graph displays the coal savings, GHG intensity reduction, and COP15 commitment opportunities of the steel sector for the same years.
The following chart displays the abatement potential for India’s steel sector for each measure, along with the necessary assumptions. Potentially, the 2030 projected emissions of 735 million tons of CO2e per year could be reduced to 573 million tons. Energy efficiency processes alone have an abatement potential of 73 million tons, shifting to scrap-based EAF has a potential of 21 million tons, and shifting to gas-based DRI, 17 million tons.

Measures:
- Energy Efficiency can be improved through improving processes, namely sinter plant heat recovery and coal moisture control. Pulverized coal injection, coke dry quenching, and recovering waste heat also helps optimize energy use.
- Savings can come from shifting fuel as well, substituting coke used in BF/BOF furnaces with fuel based on biomass (charcoal). Replacing 10% of coke as the primary blast furnace tool can also make a very sizable contribution.
- Technology chances can have a big impact. One example is direct smelting, which removes the need for coking plants. (There are issues with these technologies that need to be resolved, of course). Another is scrap-based steel making, which uses 1/3 of the energy required by standard blast furnaces. The issue here is that if 10% of the total production moved to this system, 70% of India’s steel would need to be recycled, which would come with an economic cost. Lastly, gas-based direct reduced iron and cogeneration, i.e. recovering gas from the BOF/BF process and cleaning and using it for power generation, can also help to reduce emissions.
Energy independence and the Indian steel sector:
Coking coal prices were $129 a ton in 2009-10 but increased to $225 a ton in the second quarter beginning in July 2010. India has a very high dependency on Australia for coking coal and would need 2.4 billion tonnes of steel/yr by 2030, meaning India would need to import 40% of its coal needs.
Conclusion/way forward:
The best practice gap was achieved by the cement industry in its production from coal, increasing the GHG intensity ration from 13.4 to 15.7 in 3 years. Best practice technology (BPT) replication is achievable using off-the-shelf technologies in India. BPT replication in Steel Industry alone can yield 36 million tons of coal savings and reduce India’s imports drastically as well as help India achieve more than 100% of its GHG emissions commitment to COP15 (reducing the GHG intensity of GDP by 20%-25% by 2020). We are not anti-coal as fuel but, rather, a rational promoter of the roadmap to use India’s and the globe’s diminishing coal supplies more efficiently. The most pressing needs are process optimization technology sharing throughout the steel industry and active promotion and incentivization of efficient users of coal and low-GHG intensity steel on platforms such as coal junction and metal junction.
The original report can be read here.


