Life Cycle Assessment: How Suppliers Can Meet Conscious Consumer Demands
Posted On
Only what is “Good for the Planet” is “Good for me”: The Conscious Consumer
“I experienced dry skin because of chemicals in my dishwashing soap. The discomfort made me switch to soapnut”, a friend explained as I was researching what made consumers choose consciously made products. My friend is part of a growing tribe of people who take health/sustainability/social justice matters into their hands and resort to making their own house cleaning, body care, food products, etc., themselves. Such endeavours have occasionally grown to provide these products at a small scale, either locally or to niche mostly urban groups, for example through farmers markets or through boutique and pop up stores both online and offline. They are the modern avatar of the home or cottage industry with the supply chain and financial accoutrements of the formal sector and the marketing savvy of the digital age. The credibility of the manufacturer (often self referenced as ‘artisan’) is typically established through direct contact/relationship or word of mouth and maintained through having simple products with limits to scale in terms of production and sales capacity and a highly responsive feedback loop. Because such enterprises usually involve intense efforts and levels of commitment that are not aligned with the global scale and fast pace of many, although growing in popularity, they are far from the norm.
On the other end of the spectrum are products whose standards we take for granted. Often these are mandated by law or industry norms and concern quality and manufacturing processes including conditions under which it is handled and supplied and the absence of known “contaminants”. Producers or suppliers may additionally bolster product sales with claims of convenience, accessibility and cost and with alluding to “desirability” or “goodness”. But who defines and who measures these? And where do these criteria fit with the emerging demands of the conscious consumer for “good for me, good for people, good for planet”?
While the individual consumer’s search for responsible products may have been initiated by any variety of personal concerns and motivations (often expressed as interrelated) there is also a groundswell in the same direction by civil society organisations and media. Where information on companies violating human rights and environmental laws may have once been the sole concern of activists or NGOs, their relevance to common people and their consumption habits is being recognised and highlighted. Rather than follow from individual motivations these are guided by a motivation best expressed by Wendell Berry in Native Hill, “We have lived by the assumption that what was good for us would be good for the world… We have been wrong. We must change our lives, so that it will be possible to live by the contrary assumption that what is good for the world will be good for us. And that requires that we make the effort to know the world and to learn what is good for it. We must learn to cooperate in its processes, and to yield to its limits.” Consumers, at an individual level, have begun to eschew brands that do not meet perceived ethical norms (with celebrities and influencers ceasing to endorse them). At a collective level they have begun to participate in movements such as climate strikes, in person and through digital campaigns which push governments and suppliers to be responsible for the sourcing, manufacturing, use and disposal of products. They push for the creation of new standards and new ways to hold producers accountable.
It is in this larger arena that national and international supplier platforms, online brands as well as those with physical stores, can perform a democratising function by scaling up the establishment of a new ethic for business. They bring desirable but optional standards closer to being non negotiable starting grounds. It is often the supplier platform which is the keeper of the consumers trust, from whom transparency and accountability is demanded and which stands to lose credibility when ethical norms are breached. This is beyond the traditional logistical role of connecting demand to supply. The platform can prove its integrity by investing in processes of product and producer verification. Often for small scale producers who may not have the financial capacity to undergo expensive quality testing and certification it is the supplier platform that can provide this “service”. On the other side this service breaks down the complexity of the modern product and production process and gives consumers the necessary information to make informed choices between these products/producers based on various criteria.
Life Cycle Assessment: Building Supplier and Producer Responsibility
The Better India (TBI) is an online social impact platform. One of its initiatives is its one-stop-shop that connects consumers with eco-sensitive and socially just products. Since the majority of today’s production processes involve multiple stages across diverse locations with numerous exchanges between “hands” involved, suppliers like The Better India who do not source nor sell their products locally and perhaps even the producers themselves who make these products but do not source their raw material locally may easily be unaware of all the impacts of their products. However, in an age of information technology, this is no longer a good excuse and it is precisely the effort to verify the products and producers that engender trust in suppliers and brands like TBI. TBI approached us at cBalance to help them identify house cleaning products by small scale producers that are made from “natural” and “eco-friendly” ingredients, “non-toxic” and “safe” for both users and the planet. They were keen to educate themselves and break down the elements that make up these commonly used terms. They also wanted to ensure a process that would allow them to impartially assess and choose the best options as well as to support production needs for producers who do not have the means to address these standards. The products ranged from floor cleaners to laundry detergents and from toilet cleaners to dishwashing detergents and multipurpose cleaners.
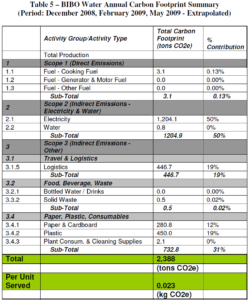
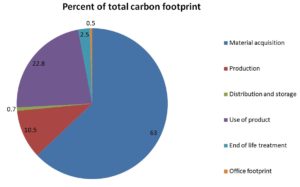
We supported TBI by conducting a life cycle assessment (LCA) of each product. ‘The term “life cycle” refers to the major activities in the course of the product’s life-span from its manufacture, use, and maintenance, to its final disposal. It is a “cradle-to-grave” approach which encompasses all activities right from the gathering of raw materials from the earth to create the product and ends at the point when all materials are returned to the earth’[i]. The process involves compiling a list of relevant material and energy inputs besides environmental emissions during a products life cycle and assessing the environmental impacts associated with these inputs and emissions. Life cycle assessment stages are illustrated in the diagram below (image 1).
Image 1: LCA stages (source: http://people.cs.uchicago.edu/~ftchong/290N W10/EPAonLCA2006.pdf)
For TBI’s purposes we also added non-ecological impact categories including social impact (contribution to local livelihoods), ethical sourcing (source of raw material), product effectiveness (eg. grease removal efficiency, stain removal efficiency, etc), product pricing and supply scale potential as part of the overall assessment. The categories would be combined into a ‘Household Cleaner Supplier Scorecard’ which would aid the TBI team in objectively and thoughtfully narrowing down on suppliers.
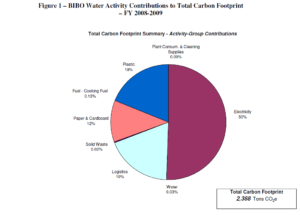
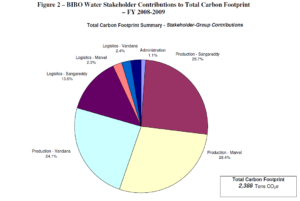
In order to be able to make appropriate assessments and comparisons cBalance developed appropriate data collection methods including supplier questionnaires, disclosure sheets, site visits and procuring product samples ( for external lab tests) . We also conducted research on the hazardous impacts of product components on human and ecosystem health. All product information was analysed using a uniquely developed ‘Excel- based LCA tool’. These LCA calculations were later combined with calculations of non-ecological aspects to develop the ‘Household cleaner supplier scorecard’ for product comparison.
—————————————————————————————————————-
Project details , processes and outputs can be found here: https://cbalance.in/wp-content/uploads/2020/11/CB_TBI_LCA_Housecleaners_v0.3.pdf
—————————————————————————————————————-
The scorecard revealed that while few supplier products had negligible ecological impact, a few of them had an unexpectedly high ecological impact. This enabled the TBI team to recognise a dearth of knowledge on negative impacts of product components among some suppliers. They recognised the need for capacity building of producers through providing handholding support to overcome product shortcomings. Additionally, TBI also worked towards ensuring reusable and refillable product packaging; an endeavour that demands consumer responsibility to return bottles for recycling and purchase refill packages to minimize life-cycle impact.
Way forward: Creating common ground
Amidst fears of “greenwashing” it is the shift in perspective away from blaming and shaming that is highlighting the way forward for consumers, producers and the market in general. TBI used the LCA not only to evaluate products and choose between suppliers but also to identify areas for improvement for itself and producers. As other producers and suppliers similarly pick up and assume responsibilities as TBI did, they are offering essential elements of trust that have long been missed in the exploitative global economy.
Another shift is in creative collaborations and making way for new language and shared standards of what is acceptable or not in production processes, and for engaging in transparent and verifiable practices. Typically LCA softwares are expensive, but an excel based LCA tool such as cBalance developed makes such efforts more affordable. For TBI it served not just as an evaluation tool but as a product enhancement tool, indicating aspects that need to be altered to minimize negative impact. In a different collaboration, such as with the Ministry of Micro, Small and Medium Enterprises it holds the potential to enable many more suppliers and even producers to be part of creating and upholding standards. The LCA tool can also be used to facilitate conversation among stakeholders, the results when presented in varying forms can serve different functions including to educate consumers. Indeed, even when the tools themselves are not necessary, such as in the contexts that we began this article with, the clarity that such frameworks bring to the table can spur many more creative possibilities. Given the times we are living in, the interconnectedness of our market systems and the social and ecological systems they depend on cannot be denied. Ensuring responsible products is therefore a responsibility that can only get lighter, easier, cheaper with more people to shoulder it.
Reference:(i) Scientific Applications International Corporation (SAIC), & Curran, M. A. (2006). Life-cycle assessment: principles and practice. http://people.cs.uchicago.edu/~ftchong/290N-W10/EPAonLCA2006.pdf
Co-author: Neesha Noronha, Editor: Vivek Gilani
