cBalance has been engaging with Wipro, an Indian Information Technology Services Corporation, to estimate their GHG emissions from air travel since 2015.
The objective of the project has been to estimate GHG emissions from air travel, analyze Wipro’s flying patterns, estimate possible reductions in GHG emissions and recommend strategies to reduce GHG emissions.
The analysis was adhered to GHG Protocol’s Corporate Standard, accompanied by IPCC Guidelines 2006 to calculate airline specific emission factors (insert footnote)
Following the equation:
GHG Emissions = Activity Data x Emission Factor
Here, the Activity Data was the distance between Airport A to Airport B, calculated using great circle equation.
Emission factor was given in terms of kg CO2e / pax-km for each airline, distinguished based on whether the flight was International or Domestic and whether the flight was short, medium or long haul (this was determined based on the distance).
For FY 2014-2015 estimated GHG emissions were 170.1 thousand tonnes CO2e, with 1,269.8 million pax-km traveled across 5.0 lac flights
For FY 2015-2016 estimated GHG emissions were 152.9 thousand tonnes CO2e, with 1,134.4 million pax-km traveled across 4.7 lac flights
During these two cycle of analysis, other than estimating the GHG emissions from air travel, the major emphasis was on quantifying reduction potential and study reduction strategies. This was achieved by modeling two scenarios :
Best-In-Class Switch :
The goal of this scenario was to determine, for a given flight, the best airline in terms of emission factor ranking for its specified route. This helped us and Wipro quantify reduction potential just by switching over to a more efficient airline.
The estimated GHG emissions reduction from Best-In-Class switch for FY 2014-2015 were 59.9 thousand tonnes CO2e and for FY 2015-2016 were 36.9 thousand tonnes CO2e
Multi-stop to Non-stop Switch :
The goal of this scenario was to determine possible reductions in GHG emissions switching from a multi-stop flight to a non-stop flight.
The estimated GHG emissions reduction from Multi-stop to Non-stop switch for FY 2014-2015 were 19.4 thousand tonnes CO2e and for FY 2015-2016 were 11.7 thousand tonnes CO2e
In total, 79.3 thousand tonnes CO2e and 48.6 thousand tonnes CO2e reductions were estimated respectively for FY 2014-2015 and FY 2015-2016
A white paper titled Reducing Air Travel Emissions can be read here, where we have ranked airlines based on their GHG Emission Factor.
FY 2016-2017 & FY 2017-2018
For FY 2016-2017 estimated GHG emissions were 130.2 thousand tonnes CO2e, with 923.7 million pax-km traveled across 2.1 lac flights
For FY 2017-2018 estimated GHG emissions were 116.5 thousand tonnes CO2e, with 836.8 million pax-km traveled across 1.9 lac flights
Since the recommendations of flying the best-in-class airline, flying non-stop over multi-stop and choosing to travel via railways and/or use video calling services were already implemented, during these cycle only emission estimation was conducted on the business unit level.
For future development, the goal is to implement emissions and a financial budgeting system with respect to flying on a business unit level with the idea that it would create responsible air travel amongst employees.
Details on the Business Units wise emissions for FY 2016-2017 can be viewed here.
Furthermore, click here to view a comparison between Economy vs Business Class emissions between FY 2016-2017 and FY 2017-2018
Eliminate Carbon Emissions (ECE) Pvt. Ltd was contracted by the IPL Management upon the recommendation of the United Nations Environment Program (UNEP) to calculate the IPL’s annual carbon footprint (i.e. an inventory of the total greenhouse gas emissions – GHGs – that contribute to climate change, resulting from direct and indirect resource consumption through DLF IPL 2010’s annual operations).
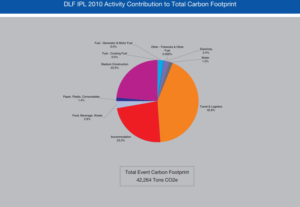
The total carbon footprint of DLF IPL 2010 was estimated to be 42,264 tons CO2e. DLF IPL 2010’s Carbon Footprint can be thought of as requiring 169,055 trees to ‘neutralise’ its impact on climate change over a period of 20 years. This equates to approximately 2,818 trees per match.
The following activities comprise its carbon Footprint, in order of decreasing magnitude: travel and logistics (18,073 tons CO2e – 42.8%), stadium construction (9,932 tons CO2e – 23.5%), luxury hotel accommodation (9,927 tons CO2e – 23.5%) , food, beverage, and waste (1,201 tons CO2e – 2.8%) and electricity (996 tons CO2e – 2.4%). These results are displayed in the chart below:
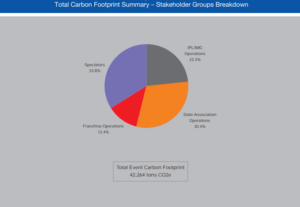
Relative stakeholder contributions to the DLF IPL 2010 Carbon Footprint are: IPL/IMG Operations (9,861 tons CO2e – 23%), state association operations (12,861 tons CO2e – 30%), franchise operations (5,243 tons CO2e – 12%), spectator activities (14,300 tons CO2e – 35%). The following chart displays the results:
A majority of the carbon footprint of DLF IPL 2010 is the consequence of activities related to its contractors, while only 23% of the footprint is a direct consequence of direct IPL/IMG managed operations. It is imperative that footprint mitigation strategies account for this aspect of footprint distribution.
Spectators are the most significant stakeholders in terms of contribution to total carbon footprint. Private vehicular travel is the single largest contributing factor – responsible for 6,517 tons CO2e (45%) of the stadium spectator carbon footprint. It is imperative to address this disproportionately heavy reliance on private transport consumed for spectator travel when addressing the overall IPL carbon footprint.
TV viewership-related carbon footprint for DLF IPL 2010 was 358,039 tons CO2e and far outweighed the contributions of any other stakeholder or activity considered within the IPL carbon footprint boundary. This component of carbon footprint, and its root cause–large quantity of consumption of electricity through TV sets–needs to be addressed with greater emphasis on its analysis and mitigation through innovative strategies and interventions in future editions of the IPL.
The impact of stadium construction, one of the primary activities contributing significantly to the IPL footprint, needs to be mitigated by intervening and exploiting opportunities to infuse low-carbon and green architecture and construction practices as the cornerstone of future stadium construction activities at proposed stadiums that are intended for use by the IPL.
Best practice examples for a majority of stakeholder functions within the IPL have been identified and quantified and their initial feasibility assessed. Best practice benchmark replication across the IPL must be pursued as a potent and actionable strategy for optimizing the carbon footprint of the IPL prior to any resource and capital-intensive carbon footprint minimisation strategies.
All interventions must be accompanied by effective communication to all internal and external stakeholders. They must also be in consonance with a well thought-out greening strategy that aims not just at a carbon neutral IPL but sets itself the loftier target of an IPL that is a net carbon sink (an indicative road map is presented in Appendix H of the original report).
Best practice incentivisation through formal programs and its incorporation into contractual negotiations processes with all vendors, contractors and other relevant stakeholders is ascertained to be the most feasible ‘first step’ on the pathway to drastically reducing the carbon footprint of IPL in the forthcoming seasons. Central IPL support and nurturing of competitive franchise behavior through formal recognition of the ‘lowest carbon footprint’ or ‘greenest’ franchise is one illustrative example that may be expanded to envelop all aspects of IPL operations in future editions.
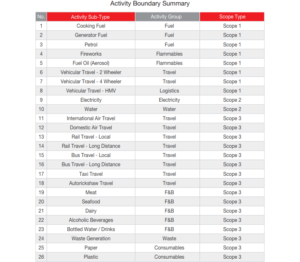
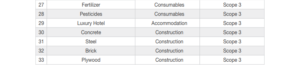
The carbon footprint determined as part of this project phase does not account for the entire life-cycle of the resources consumed and their comprehensive impact on Climate Change and ecology. Accounting for resource acquisition, processing, and disposal impacts could magnify the current extent manifold. A life-cycle analysis (LCA) of all primary resources consumed is essential to ascertain a more comprehensive carbon footprint that tends towards the true climate change impact of IPL. It is recommended that IPL 2011 be assessed on a LCA basis and that preparatory work for an LCA study be commissioned as part of the next phase of the project. The activity boundaries are outlined in the following table:
It is recommended that the IPL commission ECE to commence a comprehensive carbon footprint minimization analysis as part of a long-term ‘greening program’ (in fulfillment of its MOU with the UNEP’s Sports and Environment Unit) to identify means and alternatives for optimising and minimising its resource intensiveness.
Prior to minimising and offsetting the impact of future IPLs, it is recommended that the IPL commit to neutralise the impact of, as minimum, the four knock-out phase matches of DLF IPL 2010 (estimated to be 3,148 tons). While multiple options for offsetting are available in the conventional Carbon Offset market, the alternatives that result in equitable distribution of benefits to the grassroots stakeholder communities who are imperative to the project’s implementation are preferred as a more potent agent of social and environmental transformation.
SAI Life Sciences: An overview of the Energy Audit
Established in 1999, and utilizing its core group of experts, SAI Life Sciences has been identified to be one of the pioneers in drug manufacturing, development and discovery, solely for Pharma innovators. cBalance Solutions Pvt. Ltd (India) was contacted by them to conduct a complete thermal and electrical energy audit, which was carried over a period of 10-days from the 19th of January 2015 to the 28th of January 2015, in Karnataka.
SAI Life was aiming to achieve the objectives of a ‘green industry’ by conserving their natural resources and reducing their environmental impact from the various operations undertaken by them. In order to achieve this, the energy and related cost conservation potential based on technological interventions, architectural interventions and operational process changes needed to be determined. A comparative analysis of the financial feasibility of the proposed alternatives on a life cycle cost basis, needed establishing. All of the above, along with determining the greenhouse gas (GHG) mitigation potential, in order to reduce SAI Life Sciences’ carbon footprint was undertaken by cBalance Solutions Pvt. Ltd.
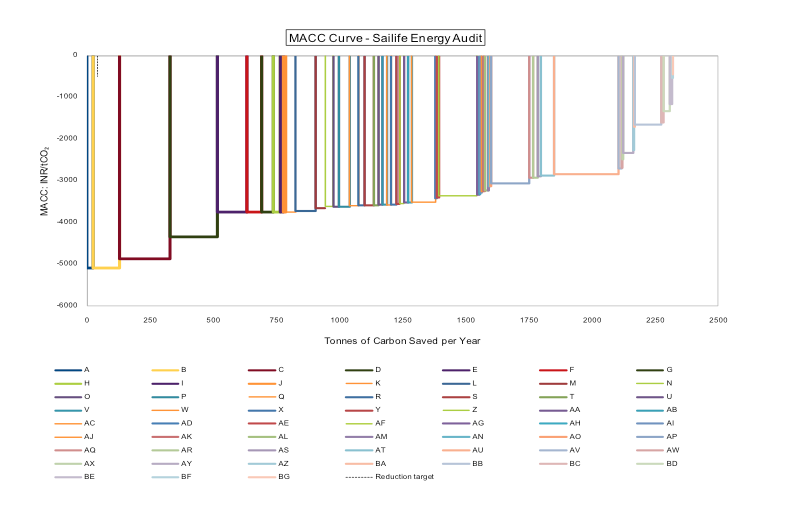
The above curve is identified to be a Marginal Abatement Cost Curve (MACC) for GHG emissions, which is often used as an important component of an institutionalized Sustainability Strategy. It helps in identifying the most cost-effective means of mitigating climate change impact, through several technological interventions and modifications in management practices. The MACC Curve helps in improving the planning of capital expenditure on Energy Efficiency, Water Conservation, Waste Reduction and Management projects, among many others, in a financially sustainable manner, while attaining the desired environmental and socio-economic sustainability benefits. Accumulating the economic benefits from the no-regret options and then stepping into the more challenging interventions is how this is generally done, thereby reducing the financial risk and ensuring longevity of the environmental program on the whole. The costs and benefits are calculated on the basis of real values of the financial parameters and resource conservation benefits of options reflecting the enhancement in technological alternatives.
When calculated for SAI Life, the analysis included the Baseline Performance Management (different power consumption patterns), Compressed Air System, Thermo-pack System, HVAC-Refrigeration System (cooling systems), Boilers and Steam System and other loads (including UPS, Scrubbers and Vacuum ejection system).
After this in-depth analysis it was found that the total current annual electrical energy consumption was approximately 57.6 Lakh kWh/year. In addition to electricity, the Plant was identified to consume 3045 metric tonnes of Coal and Biomass Briquettes for thermal energy and 102,251 liters of diesel annually for power generation. It was also identified that the electricity related emissions were considered to be the most significant supplier to the energy related GHG emissions, contributing 61% of the total emissions. Thus, a method allowing for the mitigation of electricity consumption, in order to prevent climate change on a large scale was suggested to be of a higher priority in comparison to the thermal energy conservation. The HVAC-Refrigeration system was identified to be one of the most critical components of energy consumption, thereby accounting for approximately 33.6% of the total load, followed by the Compressor and Cooling Tower Load. These three sources were identified to cumulatively contribute to approximately 84% of the total energy demand of the plant.
Here is the “MACC for GHG emissions” in table form. We recommend project A to be implemented by SAI Life management first as it offers the highest GHG emission reduction with significant annual savings and low capital cost. Project A is followed by a prioritized list of projects based on these criteria.
Pr. ID
System
Project Description
Capital Cost (INR)
Annual Savings (INR)
Payback Period (yrs)
MAC (Carbon Not Discounted)
A
Boiler System
Reduce Steam Leakage Loss
0
7,24,994
0.00
-5084.88
B
Boiler System
Improve Condensate Recovery to 40%
0
1,41,369
0.00
-5084.88
C
Boiler System
Boiler Radiation Loss Reduction
2,31,951
6,57,963
0.35
-4863.87
D
Boiler System
Flue Gas Waste Heat Recovery
15,00,000
12,65,122
1.19
-4341.57
E
Compressed Air System
Harnessing the leakage in Nitrogen Distribution Line
0
8,63,802
0.00
-3744.47
F
Compressed Air System
Proper Maintenance of Air Compressor Block 06
0
5,42,321
0.00
-3744.47
G
Compressed Air System
Proper Maintenance of Nitrogen Air Compressor up to the Air Receiver Tank
0
2,62,490
0.00
-3744.47
H
Compressed Air System
Proper Maintenance of Air Compressor Block 01
0
2,22,807
0.00
-3744.47
Project A: Steam Leakage
Capital Cost: INR 2,31,591, Annual Savings: INR 7,24,994 , Payback period: 0 years, MAC (Carbon not discounted) : -5084.88
Steam Leakage across the Plant was investigated through visual observation and complimented with the use of a Thermal Imaging Camera. Various locations were identified, wherein active steam was found leaking and four spots were identified as steam leakage hotspots upon which the steal leakage reduction strategy should be focused. It is recommended that regular surveillance and an adequate maintenance program is made for the identification of leaks on pipelines, flanges and joints. Once identified, prompt mitigation strategies should be undertaken in order to harness the low-hanging-fruit energy saving opportunity.
Project B: Condensate Recovery
Capital Cost: 0, Annual Savings: INR 1,41,369, Payback period: 0 years, MAC (Carbon not discounted) : -4863.87
Condensate Recovery from the Steam Distribution System was found to be startlingly low, with only 1,000 liters out of 25,000 TPD being recovered as condensate. This implies an exceptionally low rate of recovery (4%) further implying the rest of the condensate to be drained. Based on observations and experiential learning, it is understood that aiming to achieve a 40% condensate recovery would help in yielding an annual energy savings of approximately 330 GJ per year, eventually saving INR 1.41 Lakhs per year.
Project C: Boiler Radiation Loss Reduction
Capital Cost: 0, Annual Savings: INR 6,47,963 , Payback period: 0.35 years, MAC (Carbon not discounted) : -5084.88
In order to prevent the radiation loss, primary fuel saving opportunities available to the plant include the installation of a solar thermal system, for Boiler Feed Water pre-heating, which is identified to reduce the annual fossil fuel consumption by about 37.7%. A Waste Heat Recovery system could also be installed in order to harness the available energy, reducing the fossil fuel consumption by approximately 30%. Using these technologies would help reducing the annual electricity consumption by 4.2%, yielding energy cost savings of about 12.9% of the current annual energy bill.
The above three projects are examples of the different recommendations that are made in order to reduce the GHG emissions of SAI Life’s operational activities. Once these recommendations are put into place, SAI Life Sciences can achieve the following positive impacts on the environment and its operational costs:
Reduce Greenhouse Gas Emissions by 2,907 metric tonnes of CO2 per year (equivalent to planting approximately 11,628 trees every year)
Conserve 15.3 lakh units of electricity every year (enough to power 1,279 average Indian homes per year)
Reduce its operational cost by INR 1.42 Crore every year
The capital cost for implementing all the proposed projects is approximately INR 1.42 Crore
The payback period for these investments is a very feasible 1.24 years.
cBalance provided a detailed report, which included an in-depth assessment as a part of the energy audit and conservation strategy. The final project report can be found at http://cbalance.in/case-studies/ under the name of SAI Life Sciences.
This report presents state wise emission factors for electricity generation as well as their respective AT&C losses. To enable accurate calculation of emissions by end users in each state the two factors are also combined to present an emission factor for end user consumption of electricity in each state in India. This report, brought out by cBalance Solution Pvt. Ltd., also highlights comparative emissions of all states taking into account each ones specific emission factor which with further analysis can be used as a tool for progressive national policy making in order to help India achieve its goal of 20-25% emissions reduction from 2005 levels by 2020.
1.1 STATE OF THE POWER SECTOR IN INDIA (2009-10)
Though the total ex-bus energy availability increased by 8.0% over the previous year and the peak met increased by 7.5%, there were still significant shortages in the country both in terms of both energy and peaking availability as given below:
Energy (MU)
Peak (MW)
Requirement
8,30,594
1,19,166
Availability
7,46,644
1,04,009
Shortage
83,950
15,157
% shortage of requirement
10.10%
12.70%
The energy requirement registered a growth of 6.9% during the year against the projected growth of 8.2% and Peak demand registered a growth of 8.5% against the projected growth of 8.2%.
1.2 State wise contribution in electricity generation and consumption
About 50% of states & union territories are not self sufficient in electricity generation and are dependent on others states to fulfill their requirements.
Maharashtra is highest generator and consumer of electricity with Gujarat, Andhra Pradesh and Tamil Nadu close behind. Chattisgarh exports the largest amount of electricity at 4941 GWh while Tamil Nadu imports 4046 GWh which is the highest in the country.
2. Scope and Methodology
The data is sourced from CEA reports and calculations are done as outlined in the IPCC 2006 guidelines.
Electricity generation factor (kgCO2e/kWh)
(Emission from fossil fuels used for generation + Emission from electricity imported from other states – emission from electricity exported to other states) / Total electricity consumed by state
Fossil fuel electricity generation technologies include coal, thermal, Gas turbine generation and Diesel Generators.
Emissions from renewable energy technologies are considered to be zero.
AT&C Losses factor (kgCO2e/kWh)
(Total electricity generated by state x adjusted electricity generation factor of state x % of AT&C losses in the state)/ Total electricity consumed by state)
Adjusted generation emissions are Total electricity consumed * emission factor adjusted for import and export of electricity
The following results stand out from the above table:
Jharkhand has the highest emission factor for generation at 1.21 kgCO2e/kWh and also the highest emission factor after adjusting for import and export of electricity which is 1.33 kgCo2e/kWh
2. Bihar has the highest AT&C losses in the system due to which it has the highest emission factor for AT&C losses which is 0.86 kgCO2e/kWh. This also results in it having the highest emission factor for end user consumption of electricity at 2.1 kgCO2e/kWh.
3. The average India electricity generation emission factor is 0.89 kgCO2e/kWh and average India AT&C loss emission factor is 0.30 kgCO2e/kWh.
4. States that import electricity are liable for the corresponding proportion of emissions of each state from where electricity is imported. Hence some states like Sikkim, Assam, Manipur, Nagaland in particular appear to be “dirtier” i.e. their emission factors are quite high because they are importing electricity from states which have a high electricity generation emission factor.
3.2 State wise end user consumption emission factor of electricity
Graph 1: State wise end user electricity emission factor
In the above graph we can see almost 45% of states have an end user emission factor that is higher than the India avg. emission factor of electricity generation.
In many cases we can see that states have a low adjusted emission factor for generation but due to high AT&C losses their end user emission factor is higher than the India avg. emission factor. This point is illustrated in detail in the graph below.
3.3 State wise AT&C losses and emission factors for AT&C losses
Graph 2: State wise AT&C % losses and AT&C loss emission factors
As shown above the India average AT&C % loss is 25%. Also there is a big variation in the % losses between the grids specifically such as the South grid and NEWNE grid.
Highest AT&C % loss of 67% is recorded from Jammu & Kashmir and the lowest one recorded from D.&N. Haveli which is 11%.
About 40% states have higher AT&C system losses than the India average which points to a huge potential to save electricity with up gradation of technology and proper maintenance of transmission and distribution systems. It is also noticeable that states with difficult terrain such as hills and forests have higher AT&C losses than other states.
Another important fact visible in the graph above is that the AT&C loss emission factor is not only dependant on the quantum of losses but also on the source of electricity generation. Hence a state with low AT&C losses but “dirtier” sources of electricity generation could still have an AT&C emission factor higher than that of a state with higher losses but cleaner sources of generation. For e.g. Arunachal Pradesh has extremely high losses of about 47% but since most of its electricity is generated through hydel power its AT&C factor is less than 0.1 kgCO2e/kWh. Whereas Jharkhand has losses of only about 23% but its AT&C emission factor is about 0.3 kgCO2e/kWh since most of its electricity is generated from coal.
3.4 State wise contribution in electricity generation and emission from electricity generation
Graph 3: State wise % contribution in total electricity generation and % contribution in total emission from generation of electricity (all sources)
In the above graph we can see that a majority i.e. 23 states and UT’s contribute less than 1% each to India’s generation and emission stock. The majority generators are Maharashtra, & Gujarat and they are responsible for 9.2% and 6.8% of generation stock and 10.2% and 6.3% of emissions respectively.
Karnataka also has the lowest percentage of emissions of 2.9% with respect to it percentage of generation stock of 4.7% while Uttar Pradesh has the highest percentage of emissions of 4.3% over its percentage contribution to the generation stock at 3.3%.
4. Conclusion
A majority of emissions from the power sector are due to usage of coal as a primary medium for electricity generation (68%). There is a large potential to reduce emissions through usage of better quality of coal, more efficient technologies as well as moving to cleaner technologies such as thermal, hydro, solar etc. But these scenarios depend on various factors such as cost, geographical location, availability of raw materials etc and hence are hard to predict.
But as shown earlier, states with relatively clean generation technologies still have quite a poor end user emission factor due to major AT&C losses. This is a “low hanging fruit” opportunity for states to drastically improve their quality of electricity and emission factors. For e.g. if all states whose AT&C losses lie below the India avg. of 25% move up to atleast the average, an emission reduction of approximately 15 MTCO2e is possible. In the best case scenario if all states improve their efficiency of AT&C to the world average of 8.4% phenomenal savings of 115 MTCO2e are possible which is a reduction of about 67% of emissions due to AT&C losses. These steps can go a long way in helping India achieve its goal of 20-25% reduction in emissions over 2005 levels by 2020.
[1] Data Source : CEA – All India Electricity Statistics – General Review 2011
[2] Data Source : CEA – All India Electricity Statistics – General Review
2011
[3] Chandigarh is exporting more quantity than total generation so on the conservative principal assumed that one State whatever is importing within that it is consuming electricity embedded with higher emission.
Diu Electricity GHG EF (except AT&C Loss GHG EF) is same because it has been calculated on combined level due to non availability of quantity of exported and imported electricity.
[5] Sikkim is exporting more quantity than total generation so on the conservative principal assumed that one State whatever is importing within that it is consuming electricity embedded with higher emission.