Do you recall the excitement when a piece of clothing caught your eye while walking past a shop or surfing the internet? Your heart yearning to purchase it amidst a sea of online advertisements or busy lanes filled with the glitz and energy of vibrant garment sellers. No matter who we are or where we come from, we might all be able to relate to experiencing an emotional reaction to some or the other piece of clothing we were drawn to buy, either for ourselves or a loved one, at some point in our lives.
The textile and apparel sector is worth US $2.5 trillion worldwide and plays a significant role in a nation’s economy, employment generation and exports. The ministry of textiles annual report 2021-22 states India is the world’s 6th largest exporter of textiles. The Indian textile industry has a large unmatched raw material base and manufacturing strength across the value chain. The share of textile and apparel, including handicrafts, in India’s total exports stood at a significant 11.4% in 2020-21. It employs millions of people, which includes a large number of women from the rural population. For a textile industry manager, these statistics may look promising and can fuel the motivation to invest in expanding and propelling this economic growth. While clothing is a basic human need, it is more often than not a tool to feed capitalistic greed. A greed that feeds on socio-ecological injustice propagated by unmindful production and consumption practices. What are the injustices that are being alluded to? And what can be done to address them?
The injustices of the textile industry and a pathway to responsible production
While the textile and apparel industry might make economic sense, the ecological and social impact of the industry warrants scrutiny, given the industry’s multifaceted impact. During its life cycle, an apparel necessitates extracting, using, and disposing of resources which release toxic components into the environment. Marginalised sections of society are most vulnerable to the consequences of such insensitive apparel production practices. For instance, in Maharashtra, textile finishing colour tints the Ulhas and Waldhuni rivers blue. Another heartbreaking example is that of the Bandi River, affected by textile dye pollution, which flows through the Pali district in Rajasthan. River water testing revealed that chemicals from the Bandi had contaminated wells and hampered farming operations within a three-kilometre radius. These atrocities are evident in other countries too. A prominent example is that of the Kantamanto market in Ghana, which acts as a dumping ground for used clothing of the global north, disrupting the local textile industry and polluting the coastlines with unusable waste clothing. Incessant and mindless mass apparel production activities can therefore exacerbate the contamination of life-sustaining ecosystems, human rights abuses, and climatic disasters.
Growing public awareness and social cognisance about the environment are compelling the textile industry to produce environmentally friendly products. Consequently, many businesses and organisations are now focusing on environmentally responsible production methods. The Sustainable Apparel Coalition (SAC) is one such global, multi-stakeholder non-profit alliance aimed at supporting producers’ consumers and other stakeholders to move towards sustainability. It comprises over 250 prominent clothing, footwear, textile businesses, retailers, suppliers, service providers, trade associations, non-profits, NGOs, and academic institutions aiming to decrease environmental impact and promote social justice throughout the global value chain. The SAC created the ‘Higg Index’, a set of tools that standardise value chain sustainability assessments for all industry players.
Higg Index : An overview
The Higg Index helps stakeholders such as retailers, consumer goods brands, manufacturers, NGOs, governments and consumers to identify pathways to improve their existing practices and transition towards sustainable choices at an individual and collective level. It comprises a core set of five tools that together assess the value chain’s social and environmental performance and the product’s environmental impacts. These tools assess the environmental and social labour implications across the value chain. With this data, the sector can identify hotspots, continually improve sustainability performance, and achieve public demand for environmental and social transparency. The methodologies of the Higg Index have been developed over a decade in collaboration with SAC members, consultants, stakeholders, and industry experts.
The Higg tools include :
Higg Facility Environmental Module (FEM),
Higg Facility Social & Labor Module (FSLM),
Higg Brand & Retail Module (BRM),
Higg Materials Sustainability Index (MSI), and
Higg Product Module (PM)
The following sections elaborate on the Higg Index evaluation process for Banswara Syntex. Banswara Syntex is a vertically integrated textile mill that produces high-quality yarn, fabric and garments. The organisation embarked on the sustainable production journey with the motivation to achieve science-based targets (SBTs) for textile industries. The targets are aimed at achieving absolute reductions of climate pollution and environmental harm, irrespective of economic growth (in terms of revenue or quantity of product produced annually). cBalance supported Banswara Syntex Ltd in using the Higg Index tool as part of this effort. The Higg Facility Environmental Module was considered best suited to support Banswara Syntex’s journey towards sustainability.
The Higg Facility Environmental Module
The Higg Facility Environment (FEM) module gives a comprehensive view of a facility’s sustainability performance. It facilitates assessing water use, waste management, and chemical management, among other relevant sustainability parameters. It has robust, standardised assessment parameters, which gives it an edge over the Life cycle assessment (LCA) tool. In addition, FEM provides a much broader scope of assessment as compared to carbon footprinting which is limited only to studying GHG emissions. Overall, it helps all industry players standardise value chain sustainability measures. The obtained data aids in finding hotspots for improving sustainability performance. It informs manufacturers, brands, and retailers about the environmental performance of their individual facilities, empowering them to scale sustainability improvements besides offering a clear picture of a facility’s environmental consequences. It assists in identifying and prioritising prospects for performance enhancement.
For the Banswara project, the Higg FEM assessed the following parameters:
Site information and permits
Environmental Management Systems
Energy Use and Greenhouse Gas Emissions
Water Use
Wastewater
Emissions to Air (If Applicable)
Waste Management
Chemical Management
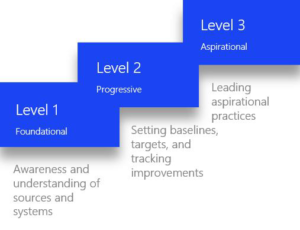
Except for the site-information and permits parameters, each parameter has questions structured in a three-level format (Levels 1, 2, and 3) that represent general thresholds of good, better, and best environmental practises.
As part of this study, responses are analysed, and a score is allocated for each parameter according to levels. Based on this, total points are calculated by adding scores of all three levels for each parameter.
The Banswara Syntex Higg Experience
Recommendations for enhanced environmental responsibility were suggested by cBalance based on Banswaras’ Higg Scores for different subsections of the Higg FEM. Besides this, impact reduction recommendations beyond Higg parameters and other relevant socio-ecological impact reduction mechanisms were suggested to ensure accountability for environmental impacts emerging from the textile plants’ activities. While all parameters of the FEM are relevant, this article focuses on only the ‘Energy’ parameter of the Banswara Higg exercise in the interest of providing a basic understanding of the Higg assessment at a glance.
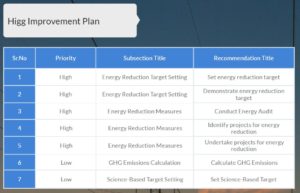
Banswara scored 80/100 for its energy-related practices. An indication of the facility’s progress at implementing a successful energy program. While good energy management provides significant benefits, including cost savings and efficiency, it requires adequate organisational focus and resources to correctly implement and be successful while reducing the impact on the environment. cBalance’s recommendations to Banswara based on its energy score are indicated in the image below :
Recommendations for other parameters, such as water, wastewater, etc. were shared as relevant based on the Higgs assessment. A detailed report which elaborates on all parameters and recommendations can be found here.
Way Forward
The textile industry is deeply intertwined with our lives, and the injustices it propels compel us to address the consequences of profit-driven human production practices that have altered the earth’s ecosystems to the point that our survival appears to be in jeopardy due to changes that are becoming increasingly onerous to reverse every day. Coalitions like SAC bring much-needed hope and motivation for mindful textile production. It provokes questions of ecological and social balance and encourages textile industries to reimagine and adopt sustainable production practices.
Healthy and responsible textile production calls for – consumers who purchase wisely and hold corporations accountable for unjust production practices, responsible textile-producing entities who look beyond profit and governments who overthrow unhealthy development agendas and move towards supporting and encouraging production and consumption practices that truly serve the planet’s needs.
As Wendell Berry, a writer, farmer and environmental activist, reminds us,
It is, therefore, only through a collaborative effort of mindful living that we can safeguard our planet’s present and future and manifest a just and habitable world for all.
Political Components of the Industrial Revolution: Parliament and the English Cotton Textile Industry, 1660-1774, Patrick O’Brien, Trevor Griffiths and Philip Hunt
‘Look beyond the electrical switch, there’s a person mining coal that will power the space you design’- A heart that empathizes with miners and a mind that considers them while designing can ensure we work to minimize the injustices our built spaces currently create. Isn’t this what our architecture and engineering education should do? Nurture responsible architects and engineers to think critically, to care and to serve not just themselves or a tiny segment, but the society, and the world?
The current education system in India mostly reflects otherwise. Information is thrust onto students instead of encouraging them to think critically and creatively. Their hearts and eyes are closed to social and ecological injustices and so the buildings and spaces built often do more harm than good. It is no longer good enough to claim ignorance. There is enough evidence that things need to change, and now. And where else to begin than at the beginning? With architecture and engineering education. Even if we don’t have all the answers, we will more likely create possible ones if we grapple with the questions rather than ignoring them, pretending they don’t exist or wishing them away.
At this juncture in history the time is right for a widespread engagement with creating a just world. The Fair Conditioning ACIP program is one such hopeful pathway for architecture and engineering educators to ensure that they do justice to their position; both as creators of just homes and spaces and as nurturers and leaders of our future professionals.
The Injustices of Air Conditioning
The Fair Conditioning ACIP program emerged from a recognition of the injustices of air conditioning. Simply put, India’s building sector is expected to augment by 4 to 5 times its current size by 2030 and given prevalent building practices, rising temperatures and increasing purchasing capacity of people inhabiting urban areas, the magnitude of window and split ACs in operation in India will grow to 225 million in 2035. Not only will ACs consume huge amounts of electricity but they will also emit what are called ‘super greenhouse gases’ – 2000 times more powerful than carbon dioxide. In addition, since a typical split-unit AC in India consumes the energy required to run 24 ceiling fans, essentially AC users deprive about 25-fold the number of persons of power to operate fans during India’s harsh summers. Beyond air-conditioning the injustices caused through increasing built space know no bounds. Inequitable energy access, inequitable water and other natural resource use, carbon pollution, health impacts, read a little more and the scope of these injustices and their consequences come crashing down on us. But we’ve known of these injustices in building design and construction for years. India has already committed to bring about a 33-35% reduction in its greenhouse gas emissions by the year 2030 at the United Nation’s Conference of Parties in Paris (COP21, 2015) and signed the Kigali Amendment to the Montreal Protocol in 2016 where we have agreed to phase out conventional refrigerants (HFCs). And there are people and institutions that have been incorporating sustainable cooling practices and technologies that are equally well known. Why then are they not being incorporated in all buildings?
The Educational Lacuna
Our research on academic curricula in India’s top 55 architecture colleges indicated that less than 25% offer courses that embed energy efficiency or sustainable design knowledge to some degree into the student’s critical thinking and design skill set. Amongst these, only 3 or 4 out of 72 courses over the course of a bachelor’s degree require a student to think and work on the environmental impact of their designs. Therefore, only 5% of India’s architecture colleges curricula is related to the environmental impact of buildings. We estimate that every year, India’s 423 architecture colleges graduate 17,000 students with deficient skills. Until now, most of the people designing buildings have graduated from this system. This means that in spite of having an Energy Conservation Building Code (ECBC), if it were to be enforced by law across all Indian states today, the workforce in place would be unable to implement it. The necessity of the hour, then, is making sustainability an inextricable aspect of architecture curricula. Just as fire safety is a non-negotiable, sustainable principles and technology should be incorporated into building design by default.
Sustainability Begins at the Beginning: The Academic Curricula Integration Program (ACIP)
With the aim of incorporating aspects of sustainable design in architecture curricula, in September 2017 the Indian Bureau of Energy Efficiency (BEE) and Council-of-Architecture (CoA) signed an MOU to integrate aspects of building physics and energy efficiency in some technical courses. In September 2018 a guidebook was published by the Ministry of Environment and Forests (MoEF): “A Guide For Integration Of Topics Related To HCFC Phase Out And Energy Efficiency In Architectural Curriculum”. Such efforts are meaningful, yet miniscule to meet the need for sustainable buildings in the coming years. Our Academic Curricula Integration Program (ACIP) has evolved over the past 8 years to contain multiple elements that facilitate the development of the culture and discourse of sustainability as well as its technologies, techniques and practices into architecture and engineering curricula.
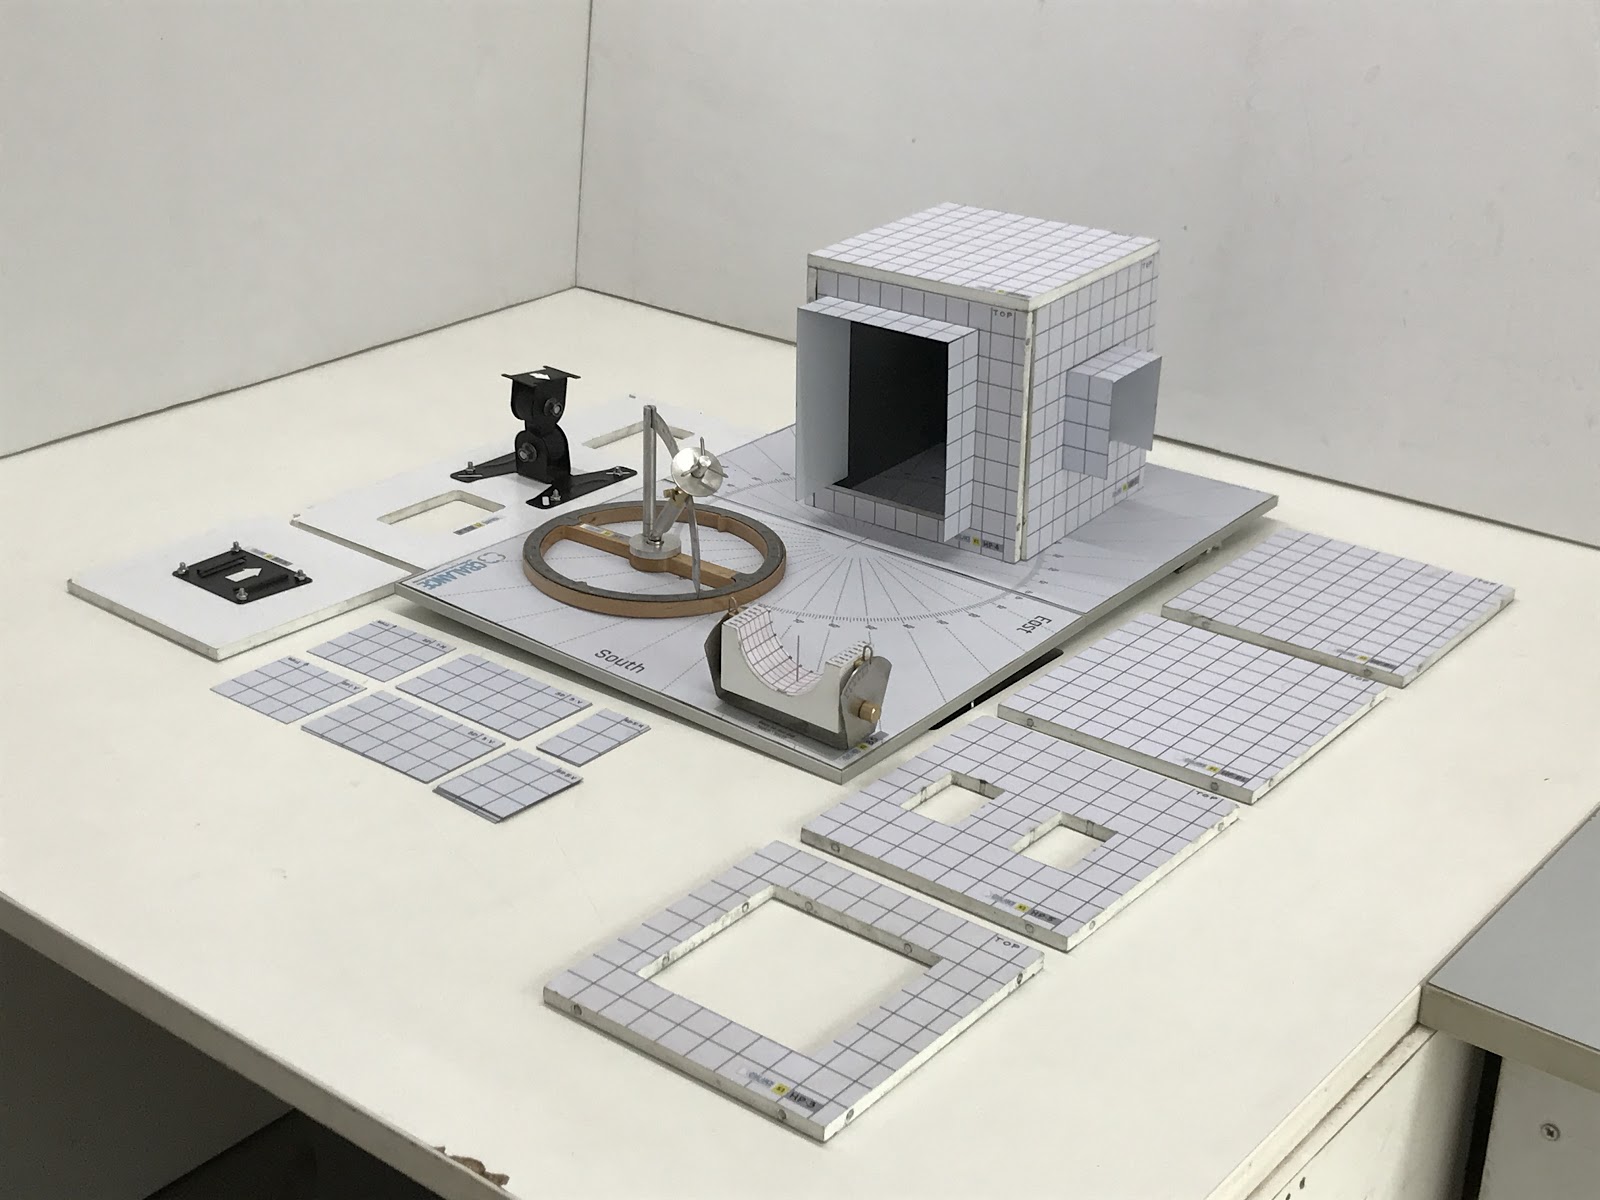
The ACIP begins with a multi day capacity building workshop for teachers of a participating college. It includes a refresher of essential technical skills related to topics like heat transfer, psychrometry, adaptive thermal comfort, passive cooling design strategies, climate analysis, and solar geometry and is followed by training modules related to science and engineering principles of sustainable cooling technologies such as structure cooling, solar vapor absorption systems, and natural refrigerants. The workshop adopts a learning-centric approach where professors experience ‘how their students can learn’ as opposed to ‘how they can teach students’. Sensitization techniques, technical concepts, teaching tools and pedagogy techniques are explored through the workshops. Further, our team supports professors towards integrating sustainable concepts seamlessly in their lesson plans during the workshop.
Exploring psychometry(a) and solar geometry(b) concepts.
While professors express enthusiasm and motivation to facilitate enriching learning experiences for their students, they also encounter challenges such as difficulty in mobilizing students to engage with new concepts and learning techniques, lack of effort or resistance from colleagues or management and difficulties in completing the lesson plan as scheduled among other barriers. With the support of behavioural change concepts such as biases, professors are encouraged to reflect and share their own approaches to these challenges. Through this process professors often report renewed enthusiasm, courage and insight to overcome them, both learning from the examples of previously participating colleges and contributing to the ongoing development of the collective field.
Beyond the initial workshop, colleges choose a pilot semester in which to integrate sustainability into the curriculum and these additional elements of ACIP enhance what began in the workshop. Engagement with the teacher cohort includes curricula integration handholding, monitoring, and troubleshooting during the pilot semester. Within this timeframe, horizontal interlinkages between sub-streams of humanities, theory, technical and design, as well as vertical integration across semesters/years are established. Our continued engagement with academia has in fact led to the inclusion of this crucial support element along with the development of pedagogy manuals, teaching aids and other knowledge materials. Professors use the Fair Conditioning ‘Sustainable Pedagogy Manual’ and a ‘DIY Physical Teaching Aid Construction Manual’ as additional resources. A ‘starter kit’ of physical teaching aids is also made optionally available at a subsidized rate to the participating colleges. (Please visit fairconditioning.org for selected resources. All resources developed under Fair Conditioning are part of the knowledge commons.)
Solar geometry teaching aid kit.
All the activities, tools (including softwares) and materials offered to professors have been designed keeping in mind the continuously evolving nature of knowledge around sustainability and also to encourage curriculum development that is inclusive and rooted in dialogue and co-creation. Mid and end semester roundtables not only allow for course correction and knowledge sharing among teachers, students and management but also provide the opportunities to amplify the program objectives of making sustainability the shared responsibility and lived practice of all. The board of studies (BOS) roundtable takes an important first step towards this by including neighbouring colleges and local board of studies members, architects and other stakeholders (practitioners in the field and other educational institutions).
Conclusion
In the words of one architecture student, “Architecture is not just an occupation, it is a responsibility”. While we believe this, we also see that it is not a responsibility to be left to the discretion of well-intentioned or extraordinarily talented, committed teachers and practitioners. Often they leave, move, transfer or are transferred. It serves none of us if only a few teachers or architects or engineers or decision makers have the head, heart and hands to make necessary changes, to lead. On the other hand it serves all of us to care about the world beyond ourselves, to engage again and again with the difficult issues no matter our capacity and to share in the responsibility of sustainability and justice. As stewards of the educational climate which is inextricably linked to the fate of our planet, we encourage and support educators to collaborate with each other and join forces to mould not just our students but the future. As Gandhi said, “True education must correspond to the surrounding circumstances or it is not healthy growth”.
cBalance has been engaging with Wipro, an Indian Information Technology Services Corporation, to estimate their GHG emissions from air travel since 2015.
The objective of the project has been to estimate GHG emissions from air travel, analyze Wipro’s flying patterns, estimate possible reductions in GHG emissions and recommend strategies to reduce GHG emissions.
The analysis was adhered to GHG Protocol’s Corporate Standard, accompanied by IPCC Guidelines 2006 to calculate airline specific emission factors (insert footnote)
Following the equation:
GHG Emissions = Activity Data x Emission Factor
Here, the Activity Data was the distance between Airport A to Airport B, calculated using great circle equation.
Emission factor was given in terms of kg CO2e / pax-km for each airline, distinguished based on whether the flight was International or Domestic and whether the flight was short, medium or long haul (this was determined based on the distance).
For FY 2014-2015 estimated GHG emissions were 170.1 thousand tonnes CO2e, with 1,269.8 million pax-km traveled across 5.0 lac flights
For FY 2015-2016 estimated GHG emissions were 152.9 thousand tonnes CO2e, with 1,134.4 million pax-km traveled across 4.7 lac flights
During these two cycle of analysis, other than estimating the GHG emissions from air travel, the major emphasis was on quantifying reduction potential and study reduction strategies. This was achieved by modeling two scenarios :
Best-In-Class Switch :
The goal of this scenario was to determine, for a given flight, the best airline in terms of emission factor ranking for its specified route. This helped us and Wipro quantify reduction potential just by switching over to a more efficient airline.
The estimated GHG emissions reduction from Best-In-Class switch for FY 2014-2015 were 59.9 thousand tonnes CO2e and for FY 2015-2016 were 36.9 thousand tonnes CO2e
Multi-stop to Non-stop Switch :
The goal of this scenario was to determine possible reductions in GHG emissions switching from a multi-stop flight to a non-stop flight.
The estimated GHG emissions reduction from Multi-stop to Non-stop switch for FY 2014-2015 were 19.4 thousand tonnes CO2e and for FY 2015-2016 were 11.7 thousand tonnes CO2e
In total, 79.3 thousand tonnes CO2e and 48.6 thousand tonnes CO2e reductions were estimated respectively for FY 2014-2015 and FY 2015-2016
A white paper titled Reducing Air Travel Emissions can be read here, where we have ranked airlines based on their GHG Emission Factor.
FY 2016-2017 & FY 2017-2018
For FY 2016-2017 estimated GHG emissions were 130.2 thousand tonnes CO2e, with 923.7 million pax-km traveled across 2.1 lac flights
For FY 2017-2018 estimated GHG emissions were 116.5 thousand tonnes CO2e, with 836.8 million pax-km traveled across 1.9 lac flights
Since the recommendations of flying the best-in-class airline, flying non-stop over multi-stop and choosing to travel via railways and/or use video calling services were already implemented, during these cycle only emission estimation was conducted on the business unit level.
For future development, the goal is to implement emissions and a financial budgeting system with respect to flying on a business unit level with the idea that it would create responsible air travel amongst employees.
Details on the Business Units wise emissions for FY 2016-2017 can be viewed here.
Furthermore, click here to view a comparison between Economy vs Business Class emissions between FY 2016-2017 and FY 2017-2018
Eliminate Carbon Emissions (ECE) Pvt. Ltd was contracted by the IPL Management upon the recommendation of the United Nations Environment Program (UNEP) to calculate the IPL’s annual carbon footprint (i.e. an inventory of the total greenhouse gas emissions – GHGs – that contribute to climate change, resulting from direct and indirect resource consumption through DLF IPL 2010’s annual operations).
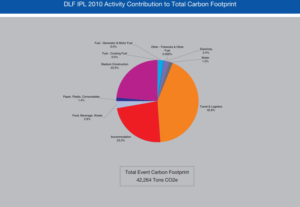
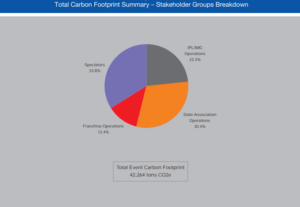
The total carbon footprint of DLF IPL 2010 was estimated to be 42,264 tons CO2e. DLF IPL 2010’s Carbon Footprint can be thought of as requiring 169,055 trees to ‘neutralise’ its impact on climate change over a period of 20 years. This equates to approximately 2,818 trees per match.
The following activities comprise its carbon Footprint, in order of decreasing magnitude: travel and logistics (18,073 tons CO2e – 42.8%), stadium construction (9,932 tons CO2e – 23.5%), luxury hotel accommodation (9,927 tons CO2e – 23.5%) , food, beverage, and waste (1,201 tons CO2e – 2.8%) and electricity (996 tons CO2e – 2.4%). These results are displayed in the chart below:
Relative stakeholder contributions to the DLF IPL 2010 Carbon Footprint are: IPL/IMG Operations (9,861 tons CO2e – 23%), state association operations (12,861 tons CO2e – 30%), franchise operations (5,243 tons CO2e – 12%), spectator activities (14,300 tons CO2e – 35%). The following chart displays the results:
A majority of the carbon footprint of DLF IPL 2010 is the consequence of activities related to its contractors, while only 23% of the footprint is a direct consequence of direct IPL/IMG managed operations. It is imperative that footprint mitigation strategies account for this aspect of footprint distribution.
Spectators are the most significant stakeholders in terms of contribution to total carbon footprint. Private vehicular travel is the single largest contributing factor – responsible for 6,517 tons CO2e (45%) of the stadium spectator carbon footprint. It is imperative to address this disproportionately heavy reliance on private transport consumed for spectator travel when addressing the overall IPL carbon footprint.
TV viewership-related carbon footprint for DLF IPL 2010 was 358,039 tons CO2e and far outweighed the contributions of any other stakeholder or activity considered within the IPL carbon footprint boundary. This component of carbon footprint, and its root cause–large quantity of consumption of electricity through TV sets–needs to be addressed with greater emphasis on its analysis and mitigation through innovative strategies and interventions in future editions of the IPL.
The impact of stadium construction, one of the primary activities contributing significantly to the IPL footprint, needs to be mitigated by intervening and exploiting opportunities to infuse low-carbon and green architecture and construction practices as the cornerstone of future stadium construction activities at proposed stadiums that are intended for use by the IPL.
Best practice examples for a majority of stakeholder functions within the IPL have been identified and quantified and their initial feasibility assessed. Best practice benchmark replication across the IPL must be pursued as a potent and actionable strategy for optimizing the carbon footprint of the IPL prior to any resource and capital-intensive carbon footprint minimisation strategies.
All interventions must be accompanied by effective communication to all internal and external stakeholders. They must also be in consonance with a well thought-out greening strategy that aims not just at a carbon neutral IPL but sets itself the loftier target of an IPL that is a net carbon sink (an indicative road map is presented in Appendix H of the original report).
Best practice incentivisation through formal programs and its incorporation into contractual negotiations processes with all vendors, contractors and other relevant stakeholders is ascertained to be the most feasible ‘first step’ on the pathway to drastically reducing the carbon footprint of IPL in the forthcoming seasons. Central IPL support and nurturing of competitive franchise behavior through formal recognition of the ‘lowest carbon footprint’ or ‘greenest’ franchise is one illustrative example that may be expanded to envelop all aspects of IPL operations in future editions.
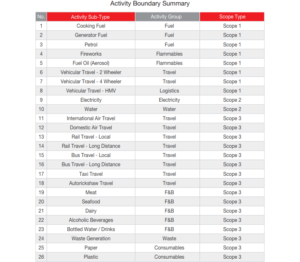
The carbon footprint determined as part of this project phase does not account for the entire life-cycle of the resources consumed and their comprehensive impact on Climate Change and ecology. Accounting for resource acquisition, processing, and disposal impacts could magnify the current extent manifold. A life-cycle analysis (LCA) of all primary resources consumed is essential to ascertain a more comprehensive carbon footprint that tends towards the true climate change impact of IPL. It is recommended that IPL 2011 be assessed on a LCA basis and that preparatory work for an LCA study be commissioned as part of the next phase of the project. The activity boundaries are outlined in the following table:
It is recommended that the IPL commission ECE to commence a comprehensive carbon footprint minimization analysis as part of a long-term ‘greening program’ (in fulfillment of its MOU with the UNEP’s Sports and Environment Unit) to identify means and alternatives for optimising and minimising its resource intensiveness.
Prior to minimising and offsetting the impact of future IPLs, it is recommended that the IPL commit to neutralise the impact of, as minimum, the four knock-out phase matches of DLF IPL 2010 (estimated to be 3,148 tons). While multiple options for offsetting are available in the conventional Carbon Offset market, the alternatives that result in equitable distribution of benefits to the grassroots stakeholder communities who are imperative to the project’s implementation are preferred as a more potent agent of social and environmental transformation.
Recycle Guru is an online platform helping citizens recycle their waste by enabling the informal recycling sector. It promotes the more sustainable use of resources to make communities healthier and cleaner and seeks to instill greater dignity in the recycling profession as well as into the perception of citizens who rely upon their services. Recycle Guru initiates the recycling process by collecting paper, plastic, metal, and glass wastes from households in Bangalore.
The motive of this project was to create a tool to estimate the Energy and GHG Emissions (or Carbon Footprint) conservation benefits of recycling versus the business-as-usual option for municipal waste management in India: landfilling. Achieved Energy saving is contextualized in terms of equivalent hour of usage of CFLs (compact fluorescent lamps), ceiling fans, laptop, washing machine, LCD TV, and the equivalent carbon sequestration capacity of trees.
Paper
Paper waste is categorized into following categories: paper sheets, newspaper inserts, newsprint, cardboard, and magazines. The Recycle Guru team observed the percentile contribution of each waste type as the following:
Paper sheets – 95%
Newspaper Inserts – 5%
Cardboard – 60%
Magazines – 40%
Life cycle emission (implies manufacturing from Virgin material, 0% recycled material) of each subcategory mentioned above is as follows:
Using the first order decay method, the emissions from disposal is estimated to be 1.725 kg CO2e/kg of waste. The total emissions saved from recycling is calculated by subtracting the life cycle emissions of the recycled material from the life cycle emissions of the virgin material and then adding the landfilling emissions. The results are displayed in the following table:
Plastic
Plastic waste consists of the following three categories: high value plastic (high density polyethylene), PET bottles (polyethylene terephthalate), low value plastic (low density polyethylene). The life cycle emissions from manufacturing for each subcategory are displayed in the table below.
Since Degradable Organic Carbon in plastic is almost negligible, methane generation from its disposal in landfills is considered to be Zero. To calculate the avoided emissions from recycling, the same formula as that for paper was used. The results are displayed in the following table:
Metal
Metal waste only contains one category comprising both aluminum and steel. As per the pattern observed so far, percentile contribution of aluminum and steel in metal waste is found to be 75% and 25%, respectively. The life cycle emissions (implies manufacturing from Virgin material, 0% recycled material) of each subcategory mentioned above is as follows:
Since degradable organic carbon in metal is almost negligible, methane generation from its disposal in landfills is considered to be zero. Emission savings for each category is estimated using the same equation as paper and plastic with the results displayed below.
Glass
Glass waste is categorized into the following categories: beer bottles (brand: Kingfisher), container glass, and generic glass. As observed so far by Recycle Guru team, there were many instances when beer bottles were counted in pieces instead of kilogram. Hence, carbon saving from beer bottles is estimated based on number of pieces taken for recycling. Kingfisher beer bottles (made up of glass) mostly come in 650ml and 330ml. These two
major categories are considered in modeling the carbon saving from piece of each type. Life cycle emission (implies manufacturing from virgin material, 0% recycled material) of each subcategory mentioned above is as follows:
Since degradable organic carbon in metal is almost negligible, methane generation from its disposal in landfills is considered to be zero. Emission savings for each category is estimated using the same equation as paper, plastic, and metal and the results are displayed in the following two tables.
As discussed above, the energy saving achieved is expressed in terms of following contexts: CFLs (compact fluorescent lamps), ceiling fans, laptop, washing machine, LCD TV, and the equivalent carbon sequestration capacity of trees. Electricity emission factor (including AT&T Loss) for Bengaluru city is 1.27 kgCO2e/kwh generated. The following table displays the results:
To find about the assumptions taken and the equations used, the original report can be read here.
The Orange County Foundation is a group of individuals who have experience in eco-friendly architecture and civil construction, and focus on sustainable urban development. The foundation has developed a self-sufficient green housing project at Pashan, Pune–the first of its kind–and is developing another green housing project, ‘Royal Orange County’ (ROC), at Rahatani Pune. This project involves eight multi-storied buildings, consisting a total of 353 residential flats. The ROC has adopted a number of sustainable and environment-friendly options, such as eco friendly architectural design buildings, renewable energy, waste management, wastewater management and low-carbon embodied construction and building materials.
Project Objectives:
Internal capacity building and skill development for the Orange County Foundation team to calculate the carbon footprint of their construction projects
License of authenticated database for India specific emission factors related to construction and building materials, electricity & energy, mobility, AFLOU, waste, and wastewater to map the environmental performance and sustainability impact of the Orange County Foundation’s projects
Life-cycle process mapping of the ROC construction to develop a toolkit for carbon ERP integration into their system
Carbon Footprinting of the design and construction phase of the ROC project
cBalance’s Roles:
Annual Enterprise-Use License for cBalance Carbon Emission Factor Database (CEFD) – cBalance authorized yearly subscription of the CEFD tool to the Orange County Foundation to map the carbon footprint of projects using India-specific emission factors of construction and building materials, energy, mobility, AFLOU, waste and wastewater.
Training to Orange County Foundation Team for Assessment of Carbon Footprint – cBalance team provided 16 hours extensive training to the Orange County Foundation team on the topic of carbon footprinting, life-cycle of a construction project and introduction to common carbon metrics for building operations. In addition, cBalance provided training on the CEFD tool and instructed how the CEFD can be helpful to choose sustainable and low-carbon activity or material alternatives.
Life-cycle Process Mapping and Toolkit Development for Carbon Footprint – The cBalance team visited the construction site and project office of the ROC. Through a site audit and interviews with project officers, cBalance mapped the activities related to the design and construction phase of the ROC. Thereafter, cBalance developed a toolkit that integrated into their existing system for mapping the life-cycle carbon footprint of the ROC and future projects.
Carbon Footprinting of Royal Orange County Residential Housing Project – The cBalance team collected data from the ROC on deforestation, electricity, fuels, and construction and building materials consumption of the construction phase of the ROC and calculated the construction phase carbon footprint using India-specific GHG emission factors. Finally, the cBalance team presented the carbon footprint analysis to the board of the Orange County Foundation.
Results:
Subscription to the CEFD and in-person training empowered Orange County Foundation team to:
calculate the carbon footprint of their projects using India-specific GHG emission factors
assess life-cycle environmental performance and sustainable impact of their projects
choose sustainable alternatives over conventional construction and building material
compare environmental performances of two different construction projects
create a baseline and frame future strategies to reduce the carbon footprint
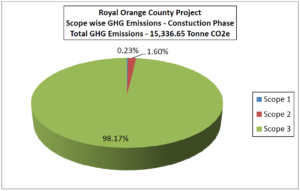
The Orange County Foundation team calculated the carbon footprint of the ROC construction phase and successfully achieved a 15% reduction in GHG emissions compared with previous projects.
The above graph demonstrates this 15% reduction. Below, the GHG emissions from the construction phase categorized by scope are displayed. As is obvious, almost all of the emissions were Scope 3.
This blog post discusses the results of a report written in 2011 by Vivek Gilani and Dr. Amit Garg on the subject of the potential for improving the coal efficiency and GHG intensity of the steel sector in India.
Facts:
The domestic cola production target for 2011-12 was 554 mt. India added 1660 MW generation capacity in July of 2011 (all thermal power), and Indian plants exceeded their power generation target that month. Additionally, Coal India Ltd (CIL) reported a 64.06% rise in profit after tax (PAT) during the first quarter (April-June) of 2011-12.
India’s coal import in 2011-12 was predicted to be 137.03 mt, with some ports seeing huge increases in the amount of incoming imported coal. The import of coking coal through Paradip port on the eastern coast of India increased from 258,479 in June 2011 to 668,574 in July, an increase of 410,095 tons, or 159%. Imports of PCI coal through Vizag port in July 2011 stood at 113,467 tons, 86,764 tons more than the 26,703 tons imported in June 2011. And the imports of Low Ash Metallurgical (LAM) coke through Paradip port in the month of July 2011 rose sharply to 60,590 tons, compared with 6,000 tons in June 2011
Domestic mining has many environmental impacts, including the issue of land usage. 171 coal mining proposals involving 28,862 hectares of forest land are awaiting forestry clearance as of June 30, 2011. 44 projects of Coal India Ltd (CIL) stuck under Comprehensive Environment Pollution India (CEPI) norms introduced b they MoEF.
Question:
Can the most efficient users of coal in India’s steel sector help India:
increase its energy independence
meet its climate change commitments
and even save some forests?
Trends:
The following chart displays the GHG intensity of production in the Indian steel sector.
As is evident from the results, coking coal is the largest contributor at 40%, with coal being the second largest at 26%. Steam turbines and grid electricity, at 12%, were also significant.
The following table describes the GHG intensity of production in various steel companies throughout the sector.
The following table, on the other hand, depicts the coal efficiency and GHG intensity enhancement of Indian steel companies. In the years 2008-2010, they substantially exceeded their COP15 commitments regarding GHG mitigation.
The following graph displays the coal savings, GHG intensity reduction, and COP15 commitment opportunities of the steel sector for the same years.
The following chart displays the abatement potential for India’s steel sector for each measure, along with the necessary assumptions. Potentially, the 2030 projected emissions of 735 million tons of CO2e per year could be reduced to 573 million tons. Energy efficiency processes alone have an abatement potential of 73 million tons, shifting to scrap-based EAF has a potential of 21 million tons, and shifting to gas-based DRI, 17 million tons.
Measures:
Energy Efficiency can be improved through improving processes, namely sinter plant heat recovery and coal moisture control. Pulverized coal injection, coke dry quenching, and recovering waste heat also helps optimize energy use.
Savings can come from shifting fuel as well, substituting coke used in BF/BOF furnaces with fuel based on biomass (charcoal). Replacing 10% of coke as the primary blast furnace tool can also make a very sizable contribution.
Technology chances can have a big impact. One example is direct smelting, which removes the need for coking plants. (There are issues with these technologies that need to be resolved, of course). Another is scrap-based steel making, which uses 1/3 of the energy required by standard blast furnaces. The issue here is that if 10% of the total production moved to this system, 70% of India’s steel would need to be recycled, which would come with an economic cost. Lastly, gas-based direct reduced iron and cogeneration, i.e. recovering gas from the BOF/BF process and cleaning and using it for power generation, can also help to reduce emissions.
Energy independence and the Indian steel sector:
Coking coal prices were $129 a ton in 2009-10 but increased to $225 a ton in the second quarter beginning in July 2010. India has a very high dependency on Australia for coking coal and would need 2.4 billion tonnes of steel/yr by 2030, meaning India would need to import 40% of its coal needs.
Conclusion/way forward:
The best practice gap was achieved by the cement industry in its production from coal, increasing the GHG intensity ration from 13.4 to 15.7 in 3 years. Best practice technology (BPT) replication is achievable using off-the-shelf technologies in India. BPT replication in Steel Industry alone can yield 36 million tons of coal savings and reduce India’s imports drastically as well as help India achieve more than 100% of its GHG emissions commitment to COP15 (reducing the GHG intensity of GDP by 20%-25% by 2020). We are not anti-coal as fuel but, rather, a rational promoter of the roadmap to use India’s and the globe’s diminishing coal supplies more efficiently. The most pressing needs are process optimization technology sharing throughout the steel industry and active promotion and incentivization of efficient users of coal and low-GHG intensity steel on platforms such as coal junction and metal junction.
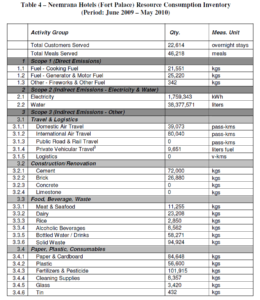
This blog post summarizes the carbon footprint calculation conducted by Eliminate Carbon Emissions Pvt. Ltd to measure the greenhouse gas emissions of the Neemrana Fort Palace Hotel (pictured below).
Goals and Scope:
The project goals were to determine with the great degree of accuracy possible the total resource consumption inventory, total carbon footprint, and the activity-differentiated carbon footprint of the Neemrana Fort Palace Hotel’s operations. The activity boundaries were categorized as Scope 1, 2, and 3 emissions, with the results displayed in the following table.
The stakeholders were defined as the primary realizer (Neemrana Fort) and the fruit jam production facility (Nainital). While many activities resulted in direct emissions (Scope 1), some resulted in indirect emissions through the generation of electricity (Scope 2), and the emissions caused by the production of goods used (Scope 3) must be included as well in a GHG inventory. The emissions of the latter group were calculated using the life cycle assessment.
Results:
The following table presents the extrapolated aggregated resource consumption inventory for the Neemrana Fort Palace Hotel.
This resource consumption resulted in a total of 3,282 tons CO2e of 0.145 tons CO2e per stay from the period of June 2009 to May 2010. The results, categorized by activity, are displayed below.
As is obvious from the results, the vast majority of the greenhouse gas emissions came from the generation of electricity (83.5%). While nothing else came close, the GHG emissions from water (2.3%), generator usage (2.5%) and meat and seafood (2.6%) were also significant. Food, beverage, and waste as a category contributed 6.2% of the total emissions. The same results are displayed in the pie chart below.
Conclusion:
With electricity generation being responsible for so much of the hotel’s GHG emissions, efforts to reduce these emissions should focus on reducing electricity consumption. Staff and guests can work together to use less electricity through a number of voluntary (or mandatory) measures.
Eliminate Carbon Emissions (ECE) Pvt. Ltd was contracted by the ‘ENGINEER 2010’ CORE to calculate their Carbon Footprint Calculation (i.e. an inventory of the total Greenhouse Gas Emissions that contribute to Climate Change), resulting from direct and indirect resource consumption through the annual technical fest’s operations. The subsequent report encompassed the first phase–‘Realise’– of the three-phase project comprising of Carbon Footprint Calculation (‘Realise’), Carbon Footprint Minimisation
(‘Minimise’) and Carbon Footprint Neutralisation (‘Neutralise’). This blog post discusses the findings of this report.
Project Goals and Scope:
The goals of the ‘Realise’ phase of the project were, to determine for ENGINEER 2010 the total resource consumption inventory, total carbon footprint, activity-differentiated annual carbon footprint, stakeholder-differentiated annual carbon footprint, and contextualization of total carbon footprint and carbon emissions intensity of stakeholder operations. The analysis of those aspects of operation would form a benchmark for assessing the impact of future members, and the aggregate and dissected carbon footprints were to be communicated in easily understandable terms. The results of this research were intended to serve as a diagnostic tool to help mitigate future carbon emissions.
Boundaries were defined in consultation with ENGINEER Management and involved two key-decision making areas, activities to be included and stakeholders to be considered. See previous blog post for discussion of protocols followed. More attention is paid to activities that are defined as ‘Key Source Categories, which are defined as those whose collective contribution account for 95% of the total footprint (when added incrementally in order of decreasing contribution). Activity boundaries categorized as Scope 1, 2, and 3 can be found in Table 1 on page 8 of the original report. Stakeholder boundaries were determined through consultation with the Client, and the results are displayed in the table below:
The following table presents the extent of LCA incorporated into the Emission Factors selected for the Carbon Footprint calculation.
Methodology:
Activity data was collected through periodic meetings with ENGINEER CORE representatives. Questionnaires were used to define relevant stakeholder groups and activities as well as to create an “activity vs. stakeholder mapping.” Electricity, water, and fuel consumption data was obtained from the previous year’s data to begin developing a pre-event estimate. To collect visitor travel activity data, detailed quantitative audience research was conducted to measure emissions, with a sample size of 10% of the expected audience being selected at random to answer a questionnaire.
Activities included within the footprint boundary were further differentiated into multiple activity sub-types. The results are displayed in table 4 on page 13 of the original report. Activity data was then multiplied by the appropriate GHG Emissions Factors developed for India, displayed in Appendix B of the same report.
Results:
The following table presents the extrapolated aggregated resource consumption inventory for ENGINEER 2010.
The total Carbon Footprint of ENGINEER 2010 for the activities presented in the first table and the stakeholders in the second is estimated to be 29.3 tons of CO2e. The following table and figure present the contributions to this total footprint differentiated across all activity groups.
As demonstrated here, travel and logistics was the largest contributor (11.2 tons CO2e–38.4%), and electricity was the second largest (9.6 tons CO2e–32.8%). Food, beverage, and waste was a distant third (4.4 tons CO2e–14.9%).
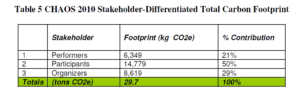
The following table and figure present the stakeholder contributions to the Carbon Footprint of all activities included within the footprint boundary.
The largest contribution is from activities related to the ENGINEER CORE (9.7 tons CO2e–33.0%).
For discussion of assumptions, data gaps, and limitations, read the original report.
Conclusion:
The Carbon Footprint estimate of 29.3 tons CO2e to serve a participant and visitor base of 4,233 persons leads to a per-participant served Carbon Footprint of approximately 6.9 kg CO2e. It must be noted, however, that the carbon efficiency of the participant stakeholder group is very high due to their use of mass transit systems and low reliance on private vehicular transport to the event. Moreover, guest accommodation was handled using in-house facilities. The elimination of luxury hotel accommodations had a drastic impact on the Carbon Footprint, as the arrangement allows for energy efficiency control and monitoring within the event premises that leads to much greater efficiency than is seen in the luxury hospitality industry in India.
In order to optimize resource and energy consumption, a few measures were recommended in the original report: Indoor temperatures can be raised by two degrees Celsius, lights can be switched off two hours per week, and home composting systems can be used for the disposal of biodegradable waste.
This blog post summarizes the carbon footprint calculation (i.e. an inventory of the total Greenhouse Gas Emissions (GHGs) that contribute to Climate Change resulting from direct and indirect resource consumption through event activities) of the IIM(A)’s CHAOS 2010 annual cultural festival, which was contracted to Eliminate Carbon Emissions Pvt. Ltd by the festival’s Organizing Committee.
Goals:
The project goals were to determine, with the great degree of accuracy possible, the following for CHAOS 2010:
Boundaries for the Carbon Footprint Calculation process were defined in consultation with CHAOS 2010 Management. Defining boundaries involved two key-decision making areas: activities to be included (i.e. defining a comprehensive yet manageable set of resources who’s consumption was to be inventoried) and stakeholders to be considered as part of the organization’s footprint (i.e. defining which sets of peoples/groups/functions are to be included within the footprint boundary).
Scope:
Since Carbon Footprint Reporting for events in India is not mandated by either the Indian Government or the United Nations Framework Convention for Climate Change (UNFCCC), and CHAOS 2010’s initiative to address its Climate Change Impacts is purely voluntary, there was no set of pre-established guidelines for boundary definition to be followed. Thus, the globally accepted methodologies for National GHG Emissions Reporting (adopted by India as part of the Kyoto Protocol) laid down by the IPCC (Inter Governmental Panel on Climate Change) as part of the 2006 Guidelines were used for guidance wherever appropriate. However, given the unique nature of this event, the overall methodology reflected a confluence of standard protocols and event-appropriate approaches which provide an accurate estimate of the Climate Change impact of a unique cultural and live-entertainment event, which CHAOS represents.
Activity Boundaries:
Contributing Directly to Carbon Footprint: Cooking Fuel Consumption, Vehicular Fuel Consumption (these are activities where an individual or business has direct control over the amount of activity and the emission coefficient through technological choices)
Contributing Indirectly to Carbon Footprint (Primary Importance): Electricity Consumption, Water Consumption (these are activities where an individual or business has direct control over the amount of activity but not the emission coefficient through technological choices)
Contributing Indirectly to Carbon Footprint (Secondary Importance): Transportation (Rail, Road, and Air Travel), Food & Beverage comprising of Meat, Seafood, Dairy, Rice, Alcoholic and Bottled Water/Soft Drink Beverage Consumption, Waste Generation, Plastic, Paper and Other Consumables (these are activities where an individual or business can be considered to not have direct control over the amount of activity nor the emission coefficient through technological choices)
Stakeholder Boundaries:
CHAOS 2010 Organization
Event Performers
Event Participants
Life-cycle Boundaries:
Methodology
The research methodology followed for the project centered around the idea of dissecting the event operations and disaggregating the consumption of resources to understand the consumption patterns ‘ground-up’. While this approach was more time-consuming, as opposed to tracking all activities through a ‘centralized’ approach, it helped construct a detailed footprint-map that would be invaluable as an analysis tool to identify stakeholder contributions to overall footprint. This data was then refined and scrutinized for inaccuracies when data appeared to be erroneous.
Results
The total carbon footprint of CHAOS 2010 for the activities and stakeholders presented previously is estimated to be 29.7 tons of CO2e.
Table 4 presents the contributions to the total carbon footprint differentiated by scope. Items identified as ‘not known’ represent data that was unavailable for analysis due to constraints encountered by data gathering personnel, and underlined quantities represent activities where consumption was estimated based on an assumed per-participant consumption quantity.
Figure 7 displays the percentage of overall GHG emissions per activity. Auto-rickshaw and flights were the two largest contributors at 29% and 21%, respectively.
Table 5 displays the GHG emissions per stakeholder. The participants, at 50%, were by far the largest contributors.
Figure 2 displays the same results in a pie chart.
Conclusions
Preemptively, Participant Travel and Waste Generation Footprints may be mitigated in future events through:
provision of mass-transit based systems, such as fuel-efficient or alternative fuel (CNG) buses, to transport participants from pre-determined nodal locations in the surrounding areas of IIM(A) to the event.
waste management principles centered around waste segregation, organic waste composting, and waste recycling must be adopted in conjunction with the rigorous participant awareness effort to ensure minimal waste is sent to landfills as an outcome of CHAOS.
Finally, based on the above analysis presented earlier, it is recommended that IIM(A) offset a significant percentage of the footprint of CHAOS 2010 (29.7 tons of CO2e) through ‘domestic’ action. It is recommended that IIM(A) review its monthly electricity consumption and set a achievable ‘percentage-reduction’ target for the first quarter during the new Academic Year beginning in mid-2010 to ‘offset’ at least 50% of the 19,192 units (i.e. 10,000 units).


")

")

")

, Beer Bottle: Total avoided emission (per piece of beer bottle)")
")


 The following graph displays the coal savings, GHG intensity reduction, and COP15 commitment opportunities of the steel sector for the same years.
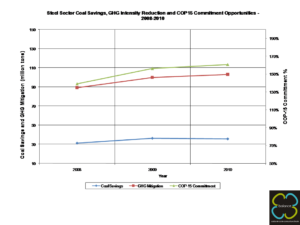


")