ENGINEER 2010 Annual Tech Fest Carbon Footprint Calculation
Posted OnEliminate Carbon Emissions (ECE) Pvt. Ltd was contracted by the ‘ENGINEER 2010’ CORE to calculate their Carbon Footprint Calculation (i.e. an inventory of the total Greenhouse Gas Emissions that contribute to Climate Change), resulting from direct and indirect resource consumption through the annual technical fest’s operations. The subsequent report encompassed the first phase–‘Realise’– of the three-phase project comprising of Carbon Footprint Calculation (‘Realise’), Carbon Footprint Minimisation
(‘Minimise’) and Carbon Footprint Neutralisation (‘Neutralise’). This blog post discusses the findings of this report.
Project Goals and Scope:
The goals of the ‘Realise’ phase of the project were, to determine for ENGINEER 2010 the total resource consumption inventory, total carbon footprint, activity-differentiated annual carbon footprint, stakeholder-differentiated annual carbon footprint, and contextualization of total carbon footprint and carbon emissions intensity of stakeholder operations. The analysis of those aspects of operation would form a benchmark for assessing the impact of future members, and the aggregate and dissected carbon footprints were to be communicated in easily understandable terms. The results of this research were intended to serve as a diagnostic tool to help mitigate future carbon emissions.
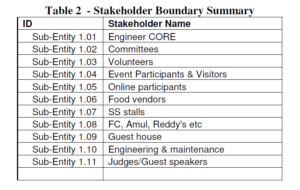
Boundaries were defined in consultation with ENGINEER Management and involved two key-decision making areas, activities to be included and stakeholders to be considered. See previous blog post for discussion of protocols followed. More attention is paid to activities that are defined as ‘Key Source Categories, which are defined as those whose collective contribution account for 95% of the total footprint (when added incrementally in order of decreasing contribution). Activity boundaries categorized as Scope 1, 2, and 3 can be found in Table 1 on page 8 of the original report. Stakeholder boundaries were determined through consultation with the Client, and the results are displayed in the table below:
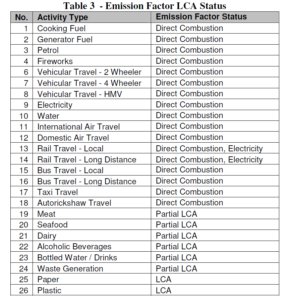
The following table presents the extent of LCA incorporated into the Emission Factors selected for the Carbon Footprint calculation.
Methodology:
Activity data was collected through periodic meetings with ENGINEER CORE representatives. Questionnaires were used to define relevant stakeholder groups and activities as well as to create an “activity vs. stakeholder mapping.” Electricity, water, and fuel consumption data was obtained from the previous year’s data to begin developing a pre-event estimate. To collect visitor travel activity data, detailed quantitative audience research was conducted to measure emissions, with a sample size of 10% of the expected audience being selected at random to answer a questionnaire.
Activities included within the footprint boundary were further differentiated into multiple activity sub-types. The results are displayed in table 4 on page 13 of the original report. Activity data was then multiplied by the appropriate GHG Emissions Factors developed for India, displayed in Appendix B of the same report.
Results:
The following table presents the extrapolated aggregated resource consumption inventory for ENGINEER 2010.
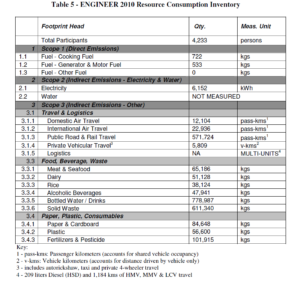
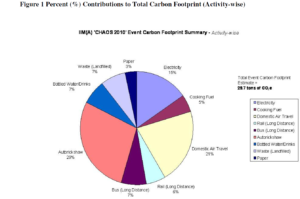
The total Carbon Footprint of ENGINEER 2010 for the activities presented in the first table and the stakeholders in the second is estimated to be 29.3 tons of CO2e. The following table and figure present the contributions to this total footprint differentiated across all activity groups.
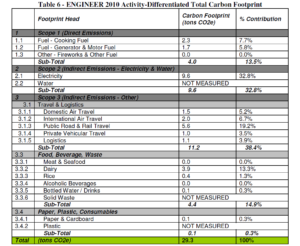
As demonstrated here, travel and logistics was the largest contributor (11.2 tons CO2e–38.4%), and electricity was the second largest (9.6 tons CO2e–32.8%). Food, beverage, and waste was a distant third (4.4 tons CO2e–14.9%).
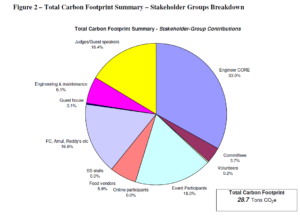
The following table and figure present the stakeholder contributions to the Carbon Footprint of all activities included within the footprint boundary.
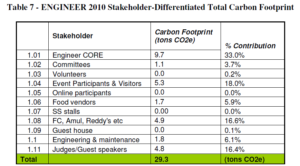
The largest contribution is from activities related to the ENGINEER CORE (9.7 tons CO2e–33.0%).
For discussion of assumptions, data gaps, and limitations, read the original report.
Conclusion:
The Carbon Footprint estimate of 29.3 tons CO2e to serve a participant and visitor base of 4,233 persons leads to a per-participant served Carbon Footprint of approximately 6.9 kg CO2e. It must be noted, however, that the carbon efficiency of the participant stakeholder group is very high due to their use of mass transit systems and low reliance on private vehicular transport to the event. Moreover, guest accommodation was handled using in-house facilities. The elimination of luxury hotel accommodations had a drastic impact on the Carbon Footprint, as the arrangement allows for energy efficiency control and monitoring within the event premises that leads to much greater efficiency than is seen in the luxury hospitality industry in India.
In order to optimize resource and energy consumption, a few measures were recommended in the original report: Indoor temperatures can be raised by two degrees Celsius, lights can be switched off two hours per week, and home composting systems can be used for the disposal of biodegradable waste.
The original report can be read here.