Recycle Guru is an online platform helping citizens recycle their waste by enabling the informal recycling sector. It promotes the more sustainable use of resources to make communities healthier and cleaner and seeks to instill greater dignity in the recycling profession as well as into the perception of citizens who rely upon their services. Recycle Guru initiates the recycling process by collecting paper, plastic, metal, and glass wastes from households in Bangalore.
The motive of this project was to create a tool to estimate the Energy and GHG Emissions (or Carbon Footprint) conservation benefits of recycling versus the business-as-usual option for municipal waste management in India: landfilling. Achieved Energy saving is contextualized in terms of equivalent hour of usage of CFLs (compact fluorescent lamps), ceiling fans, laptop, washing machine, LCD TV, and the equivalent carbon sequestration capacity of trees.
Paper
Paper waste is categorized into following categories: paper sheets, newspaper inserts, newsprint, cardboard, and magazines. The Recycle Guru team observed the percentile contribution of each waste type as the following:
Paper sheets – 95%
Newspaper Inserts – 5%
Cardboard – 60%
Magazines – 40%
Life cycle emission (implies manufacturing from Virgin material, 0% recycled material) of each subcategory mentioned above is as follows:
Using the first order decay method, the emissions from disposal is estimated to be 1.725 kg CO2e/kg of waste. The total emissions saved from recycling is calculated by subtracting the life cycle emissions of the recycled material from the life cycle emissions of the virgin material and then adding the landfilling emissions. The results are displayed in the following table:
Plastic
Plastic waste consists of the following three categories: high value plastic (high density polyethylene), PET bottles (polyethylene terephthalate), low value plastic (low density polyethylene). The life cycle emissions from manufacturing for each subcategory are displayed in the table below.
Since Degradable Organic Carbon in plastic is almost negligible, methane generation from its disposal in landfills is considered to be Zero. To calculate the avoided emissions from recycling, the same formula as that for paper was used. The results are displayed in the following table:
Metal
Metal waste only contains one category comprising both aluminum and steel. As per the pattern observed so far, percentile contribution of aluminum and steel in metal waste is found to be 75% and 25%, respectively. The life cycle emissions (implies manufacturing from Virgin material, 0% recycled material) of each subcategory mentioned above is as follows:
Since degradable organic carbon in metal is almost negligible, methane generation from its disposal in landfills is considered to be zero. Emission savings for each category is estimated using the same equation as paper and plastic with the results displayed below.
Glass
Glass waste is categorized into the following categories: beer bottles (brand: Kingfisher), container glass, and generic glass. As observed so far by Recycle Guru team, there were many instances when beer bottles were counted in pieces instead of kilogram. Hence, carbon saving from beer bottles is estimated based on number of pieces taken for recycling. Kingfisher beer bottles (made up of glass) mostly come in 650ml and 330ml. These two
major categories are considered in modeling the carbon saving from piece of each type. Life cycle emission (implies manufacturing from virgin material, 0% recycled material) of each subcategory mentioned above is as follows:
Since degradable organic carbon in metal is almost negligible, methane generation from its disposal in landfills is considered to be zero. Emission savings for each category is estimated using the same equation as paper, plastic, and metal and the results are displayed in the following two tables.
As discussed above, the energy saving achieved is expressed in terms of following contexts: CFLs (compact fluorescent lamps), ceiling fans, laptop, washing machine, LCD TV, and the equivalent carbon sequestration capacity of trees. Electricity emission factor (including AT&T Loss) for Bengaluru city is 1.27 kgCO2e/kwh generated. The following table displays the results:
To find about the assumptions taken and the equations used, the original report can be read here.
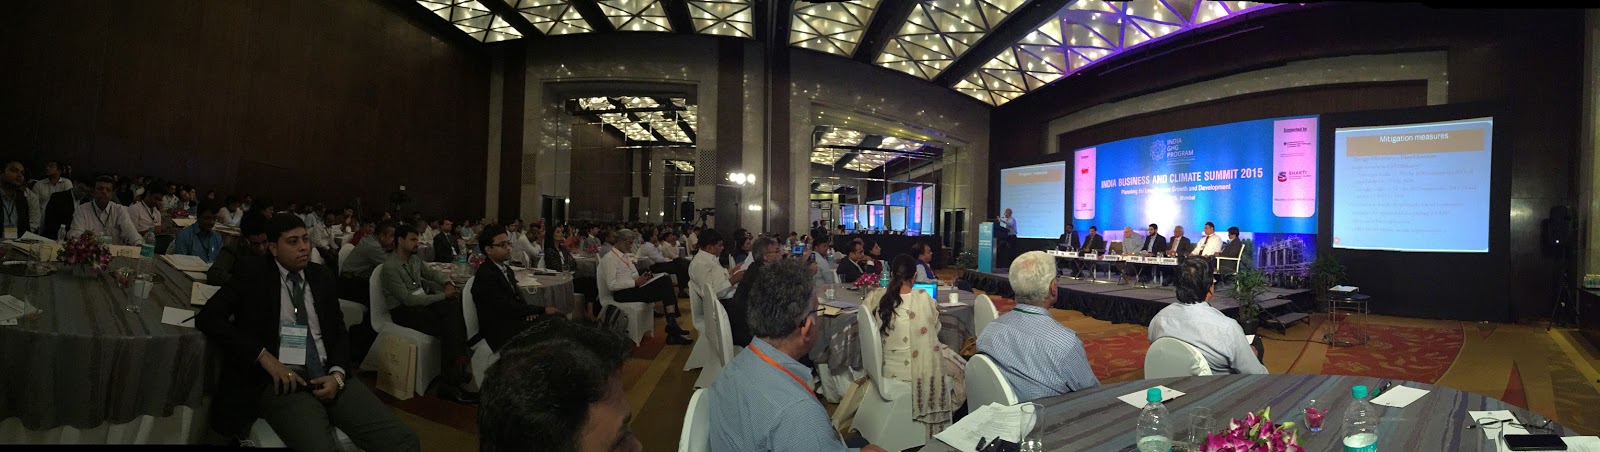
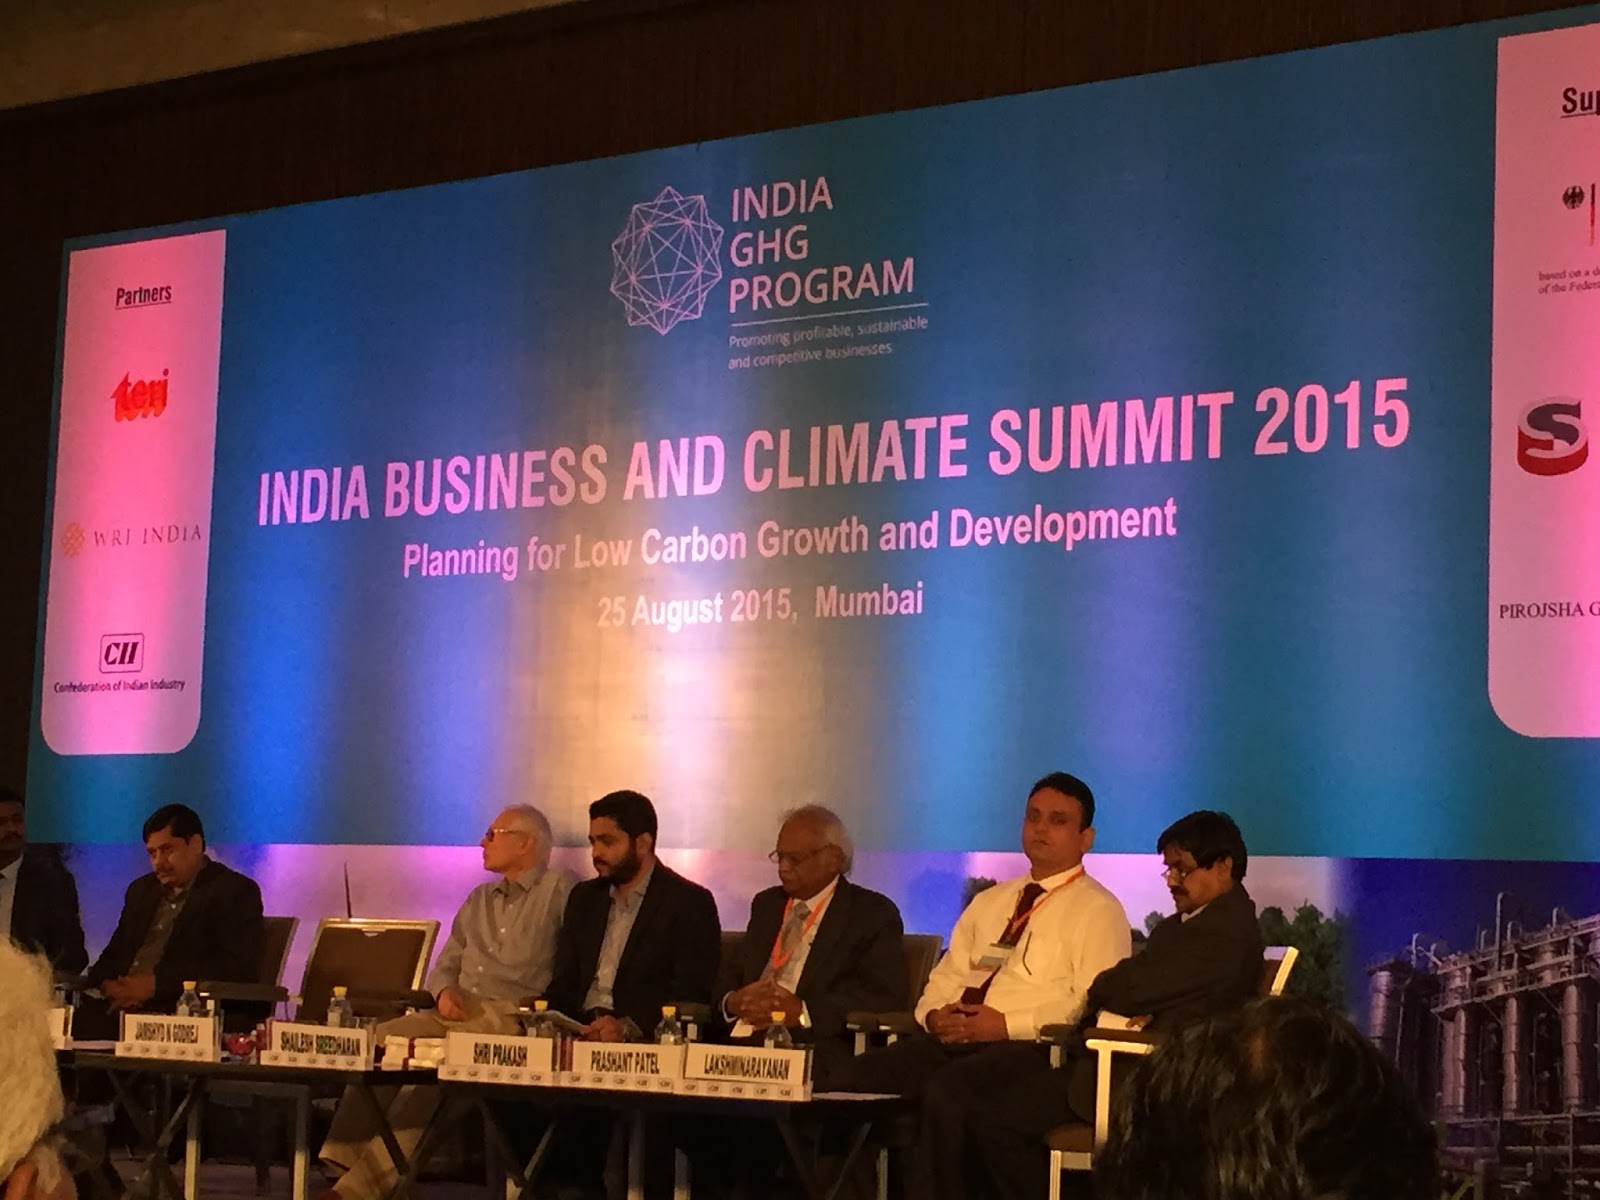
Yesterday, I attended “The India Business and Climate Summit 2015” held at the Hyatt Regency in Mumbai. I have quoted several people below from the notes I took during the summit – excuse me if I get something wrong or cut something out.
Andrew Steer
President and CEO of the World Resources Institute (WRI)
The event kicked-off with a video message from the President of the WRI. “Measure your scope 1 emissions because it’s not only good for the planet but also good for your bottom line. Also, look at across your whole value chain and suppliers – scope 2 and 3 – because again, it’s good for your bottom line.”
S. Raghupathy
Executive Director, CII – IGBC
“We have a moral responsibility to cut climate emissions
We (India) are #3 in the world – 2 billion tons per year
Renewable energy has the potential to transform the country
Cement industry in India has the lowest specific emissions from any Cement Industry in the world
3,300 projects, 3.1 billion square feet of green buildings, are built or planned
Because reducing emissions makes good business sense
Climate change is a cost saving opportunity
India GHG program is a platform for to learn from each other and have concrete projects on the ground and make things radically different
Main aim is to have nearly 200 companies involved and have inventory of their carbon emissions and take steps to reduce their emissions
Right now 41 companies which includes 15-20% of emissions are registered with India GHG
Outcome of this program, reducing emissions makes good business sense.”
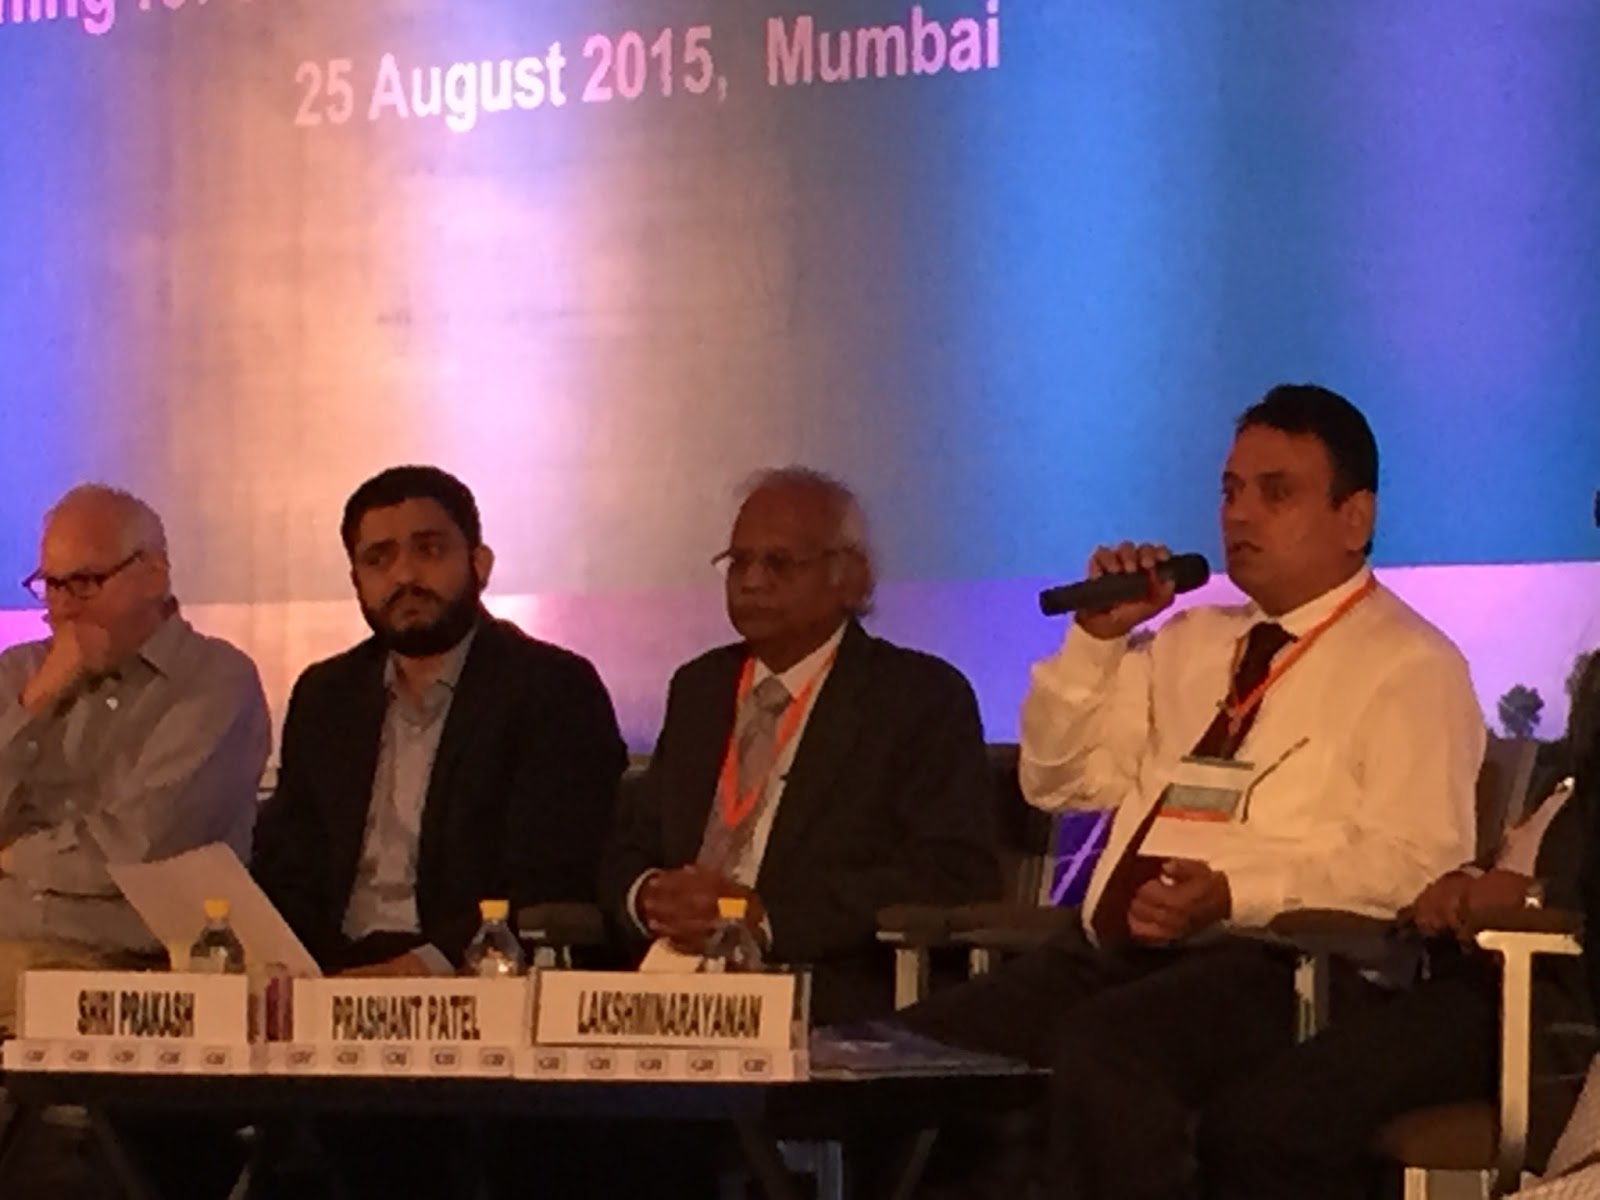
Shri Prakash
Consultant with The Energy and Resources Institute (TERI)
“As a senior citizen, I miss the clean air and bath in river Ganga. As all of us know that climate change is real, last month in July was one of the hottest months since we started measuring temperatures globally. The first 7 months of this year have been the hottest on record. We’ve also seen the extreme events, cyclones and…there is no doubt about it. This is all happening because the GHG emissions are growing. There is also no doubt that we should do something about it.
In December, we will have a summit where we have to submit what we will do – they have got different problems, developed countries and developing countries. And we in India face lots of problems like hunger and poverty. TERI environmental surveys show that economic growth is important and environmental growth is important as well. What is more important?
There is a growing number of people who want both – environmental and economic growth. Our mission is very clear we have to find new technologies and use existing technologies to reduce GHG emissions. There are technologies available, 4 sectors – power, transport, buildings – we can achieve GHG emission reduction using the technologies available today. Transport is responsible for 23% of emissions globally. This will remain the same, GHG emissions are a part of growth in private sectors.”
Dr. Naushad Forbes
Director Forbes Marshall
“I come from a company that works in the energy conversation area. Clearly, the philosophy of TERI, WRI and Confederation of Indian Industry (CII) is reducing emissions is good for business. Let me tell you about a study in 2013. We took the average energy consumption per unit of output per six different sectors. One case study that came out of that was between the most efficient and least efficient breweries in the country. Both breweries are in Aurangabad, 3 km apart, same equipment manufacturers, and the difference in energy efficiency is between 21%. We first did this study in 2003 and again in 2013. Firms in 2013 were 30% more efficient vs 2003, but there was still 21% gap in efficiency between the most efficient firms and the least efficient. In Japan, they set up a ‘Cool Biz’ campaign to set all buildings and public spaces thermostat at 26 degrees, and after Fukushima they made it 28 degrees in the summer. The energy cooling load dropped by 50%. Now, during summer, 15 June to 15 Sept, suits are done away with. As energy prices have increased, the pressure to reduce energy conversation has reduced.
Can a company introduce an internal 100% tax within the company? If I pay Rs. 13 for gas then I put Rs. 13 in a bank account to spend on green initiatives. If you start paying this tax, you will take it seriously. There is great potential for this type of voluntary fund.”
Jamshyd Godrej
Chairman of Godrej & Boyce
“Suresh Prabhu’s first love has been the environment and climate change. We have one of the lowest per capita emissions in the world, but that is not a badge of honor for us. I think a badge of honor will be when we can reduce the overall energy use. A big issue is urban waste. Industry had done a significant amount. The most important thing we can do is to measure and then do something about it. We need to think about an internal tax on ourselves, and this will make us think more about it. The Govt. of India has put a tax on coal. I think this can be expanded to be a tax on carbon. These are the types of big issues we should think about and grapple with. Like the old joke, how do you eat an elephant? One bite at a time. Similarly, we need to address this issue one step at a time.”
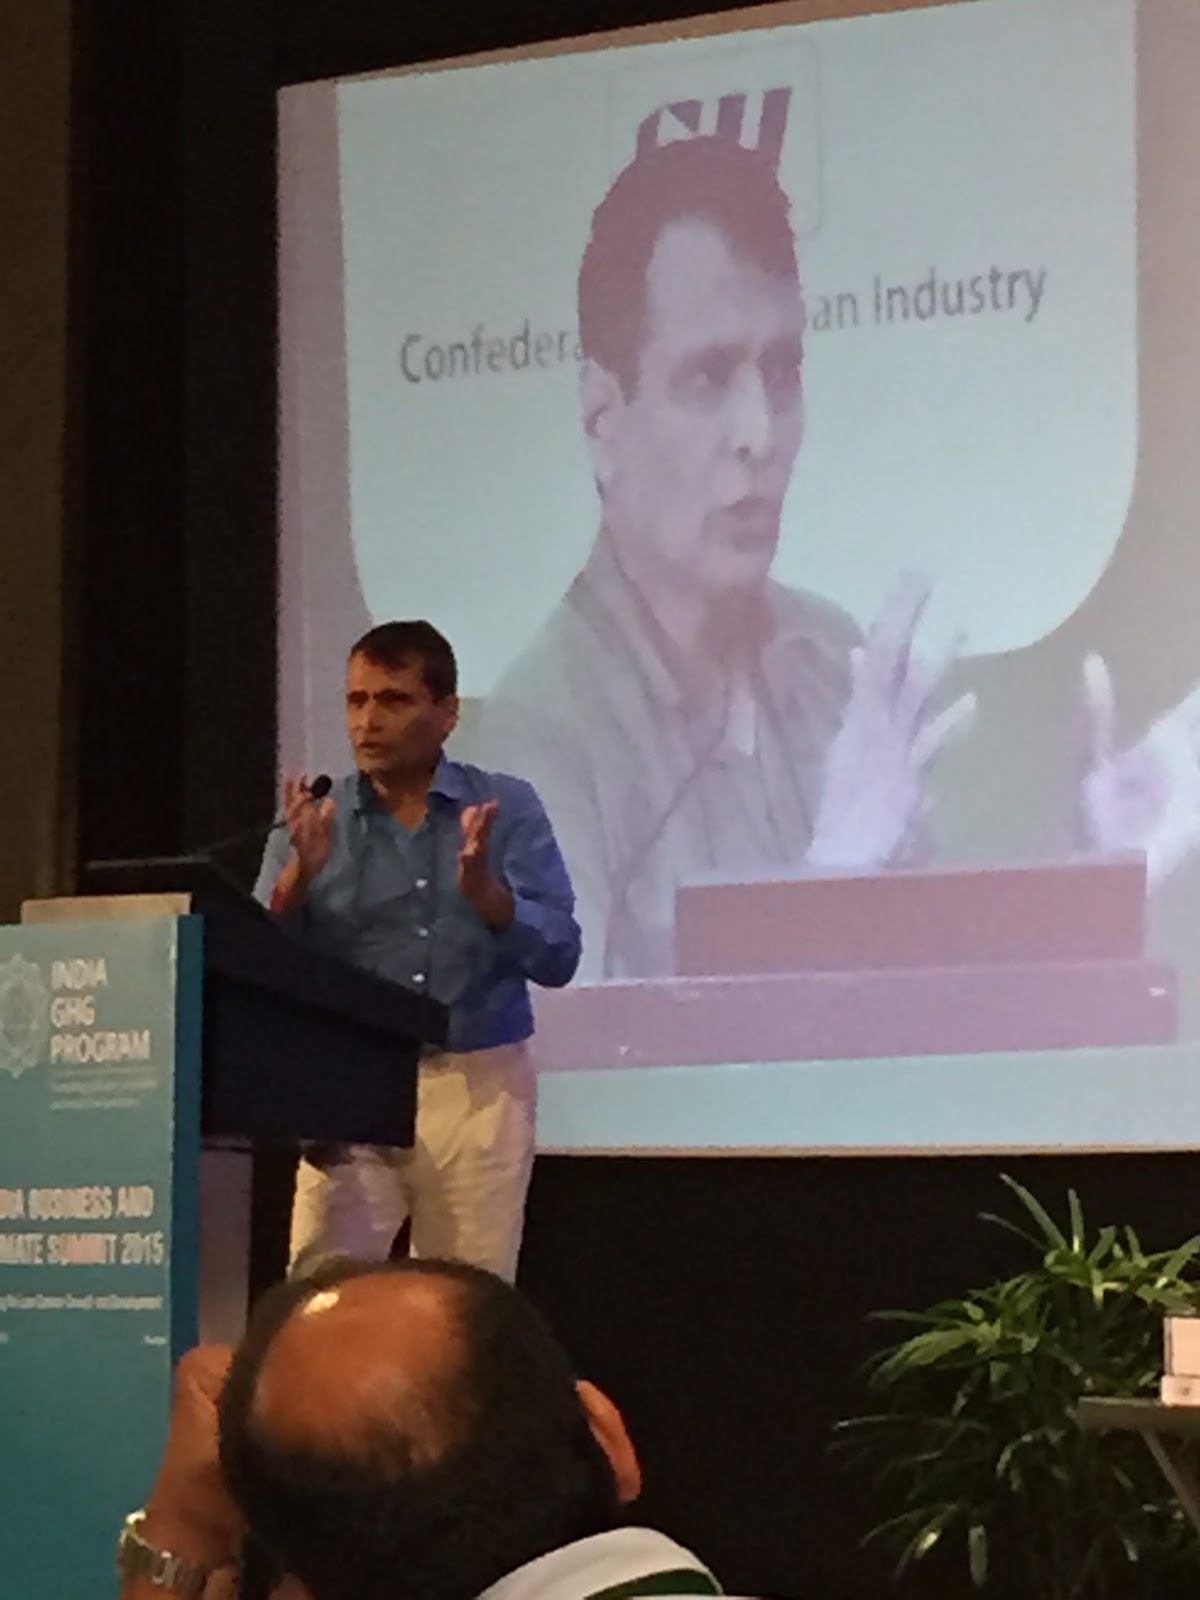
Suresh Prabhu
Honorable Railway Minister of India
“In the next few weeks, a very important conference is coming up in Paris. This day long meeting (the summit) will help inform those ‘negotiations’.
Today, the Chinese market dropped by 6%. Financial markets have been integrated by human interaction. The ecosystem has been integrated for millions of years since the planet was born – GHG affects every one of us. Post 2008, the financials markets started contracting. Europeans were more interested in saving banks than saving plant. The economy distracted us from working on climate change.
Look at the intensity of drought or flooding, this has something to do with climate change.
Making less carbon emissions makes good business sense. Mr Godrej, he’s doing it to protect his bottom line but also to protect the environment itself. This is good for everybody – good for business, good for people. You can have both – low carbon growth and development. This is all possible and we can make it happen.
Railways are the single largest user of energy in India – two forms of energy – electricity and diesel. We did an energy audit. We are working to increase solar as it has major opportunities.
Trying to put roof top for solar – solar thermal, putting solar panels on the top of the train and all the energy used in the train for fans and lights, can be powered by solar.
How can it help the railways? Railways second biggest item of expenditure is energy. So we must save energy, it improves profitability and we all see that. This makes business sense and ecological sense. This is a bottoms up approach to have an integrated approach – sustainability, social issue and profit. If we address this challenge, quality of life will improve – air, toxics, if you do this you don’t need so many hospitals, you don’t need so many medicines. Self-motivated action is more important than regulated action. If we can have a water audit…the first casualty of GHG in our atmosphere is water.”
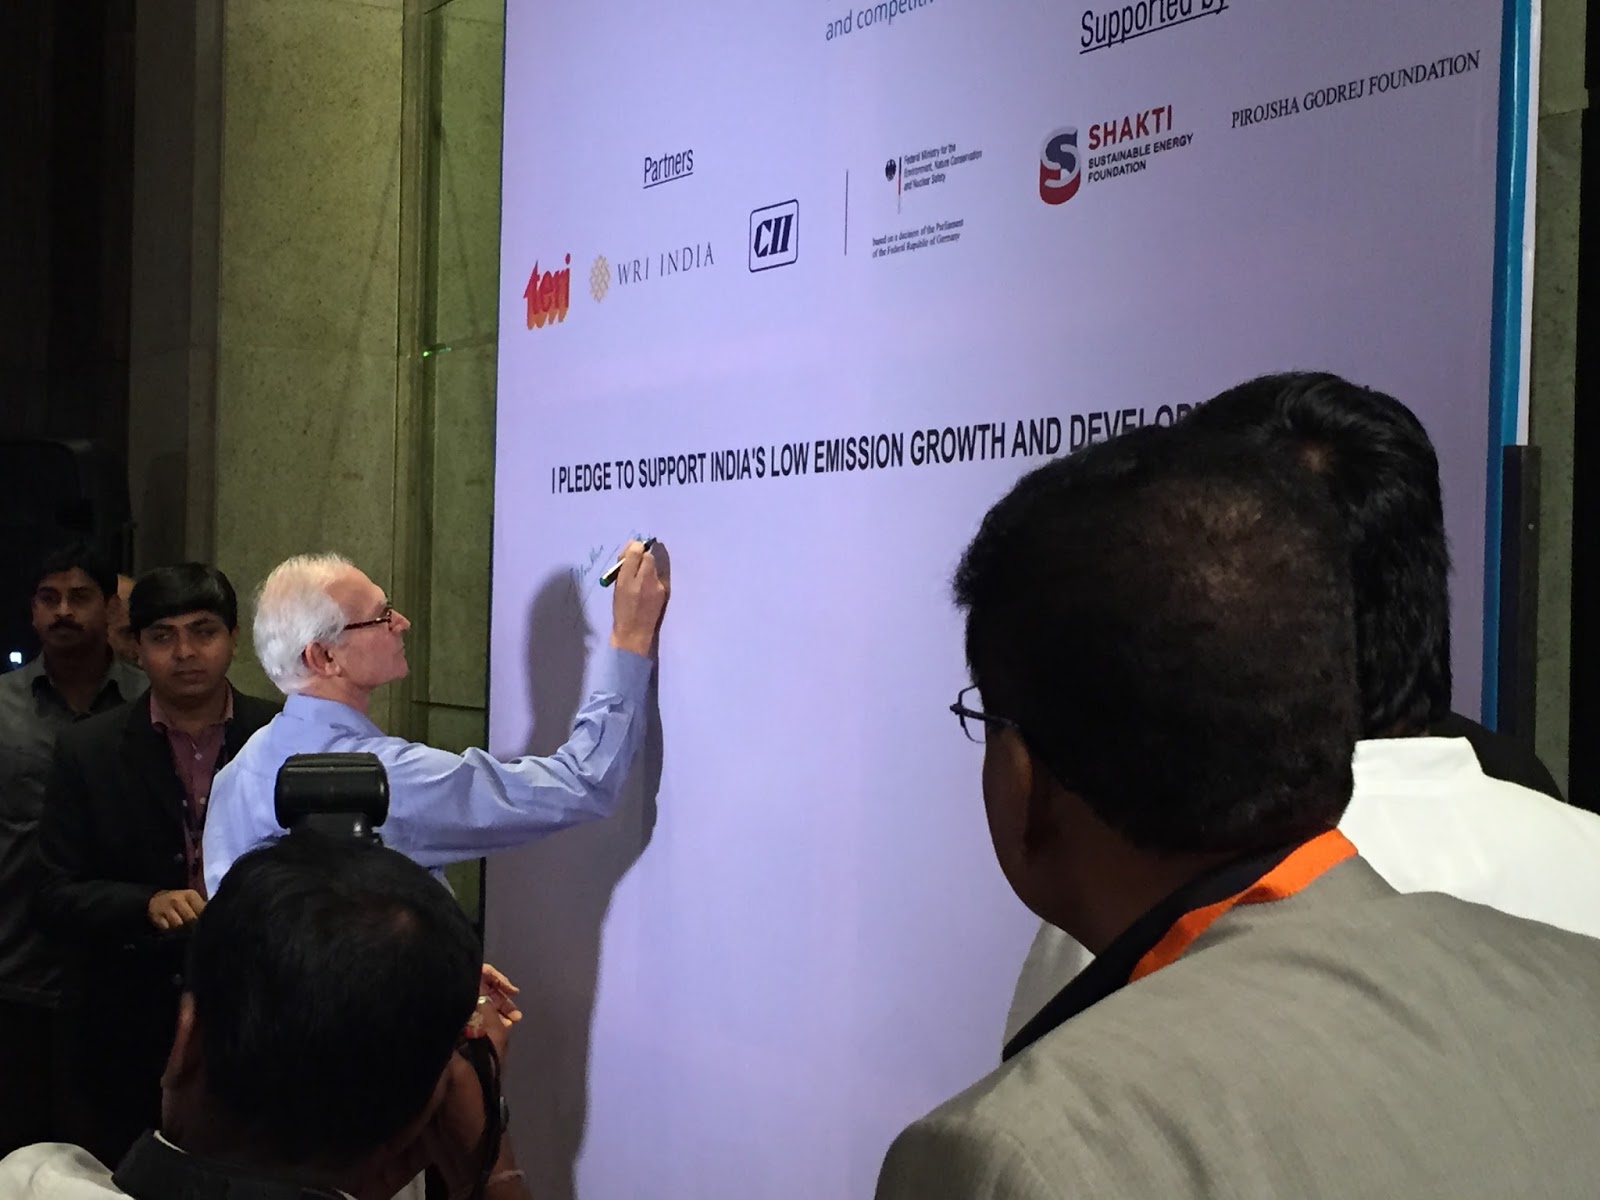
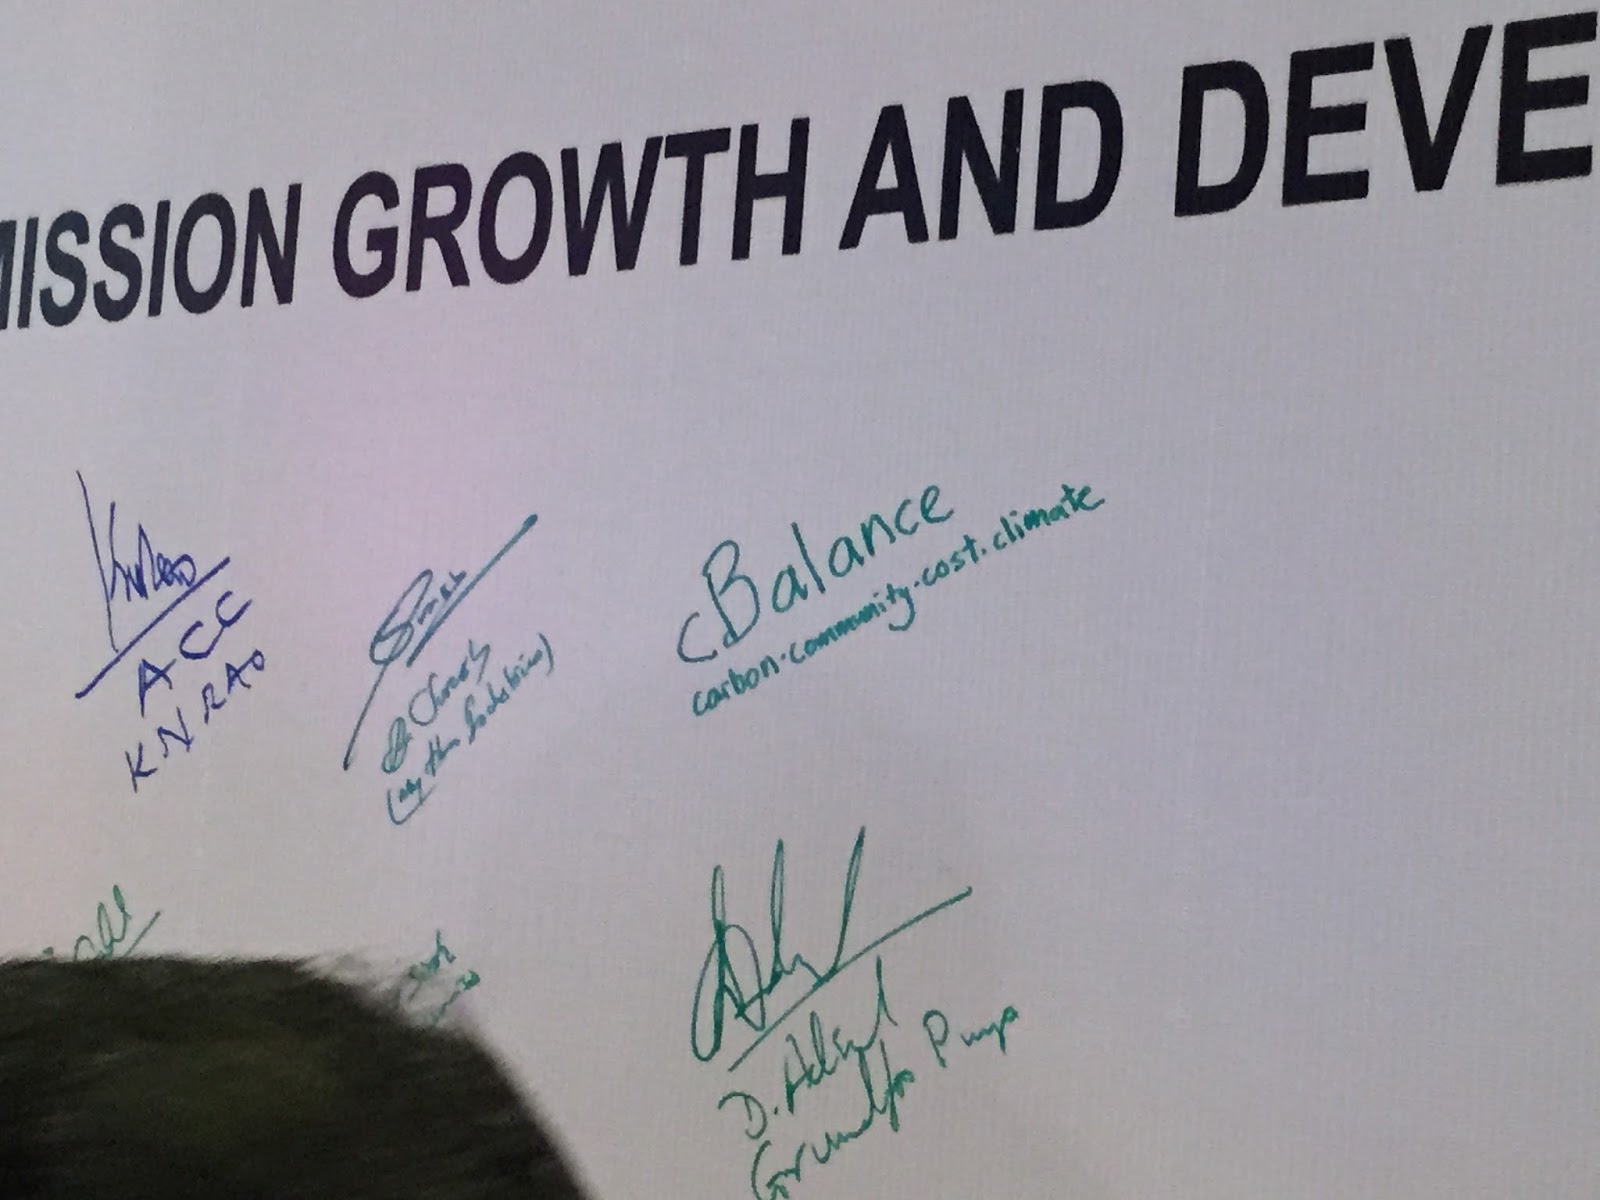
Jamshyd Godrej signing a pledge to support India’s low emission growth and development.
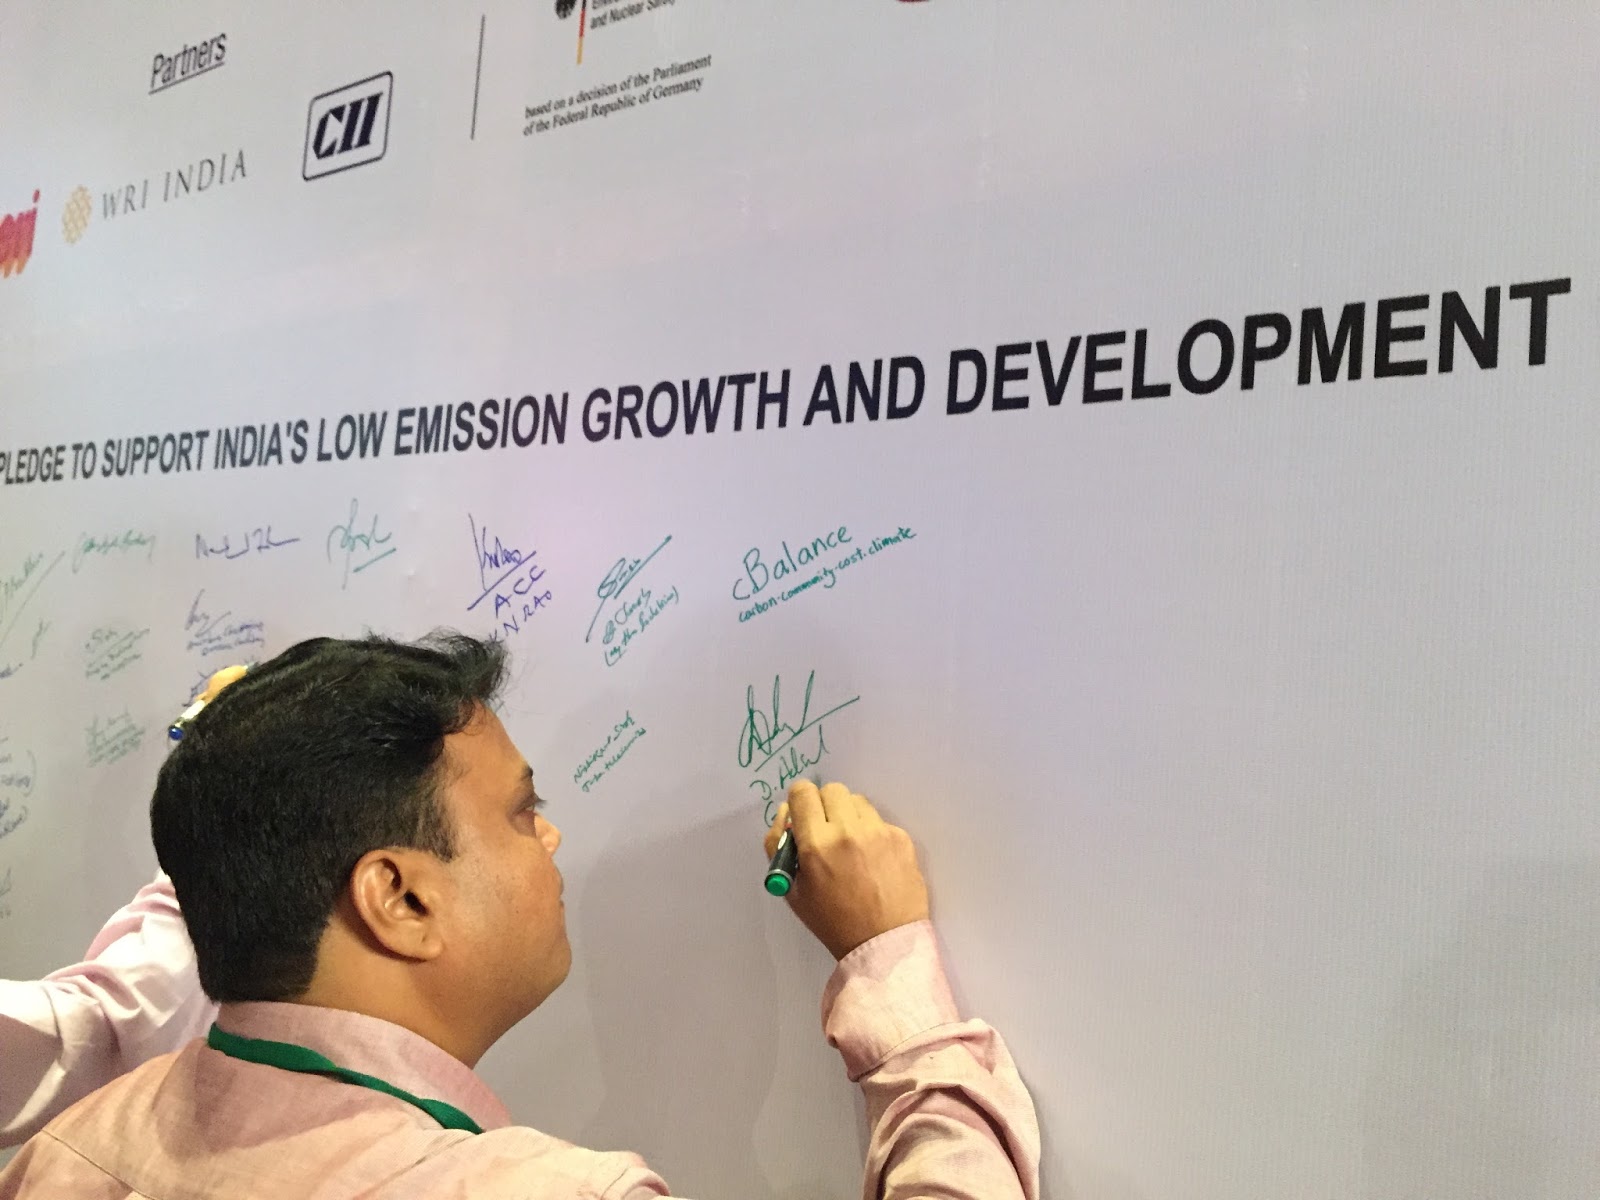
cBalance signing the pledge as well.
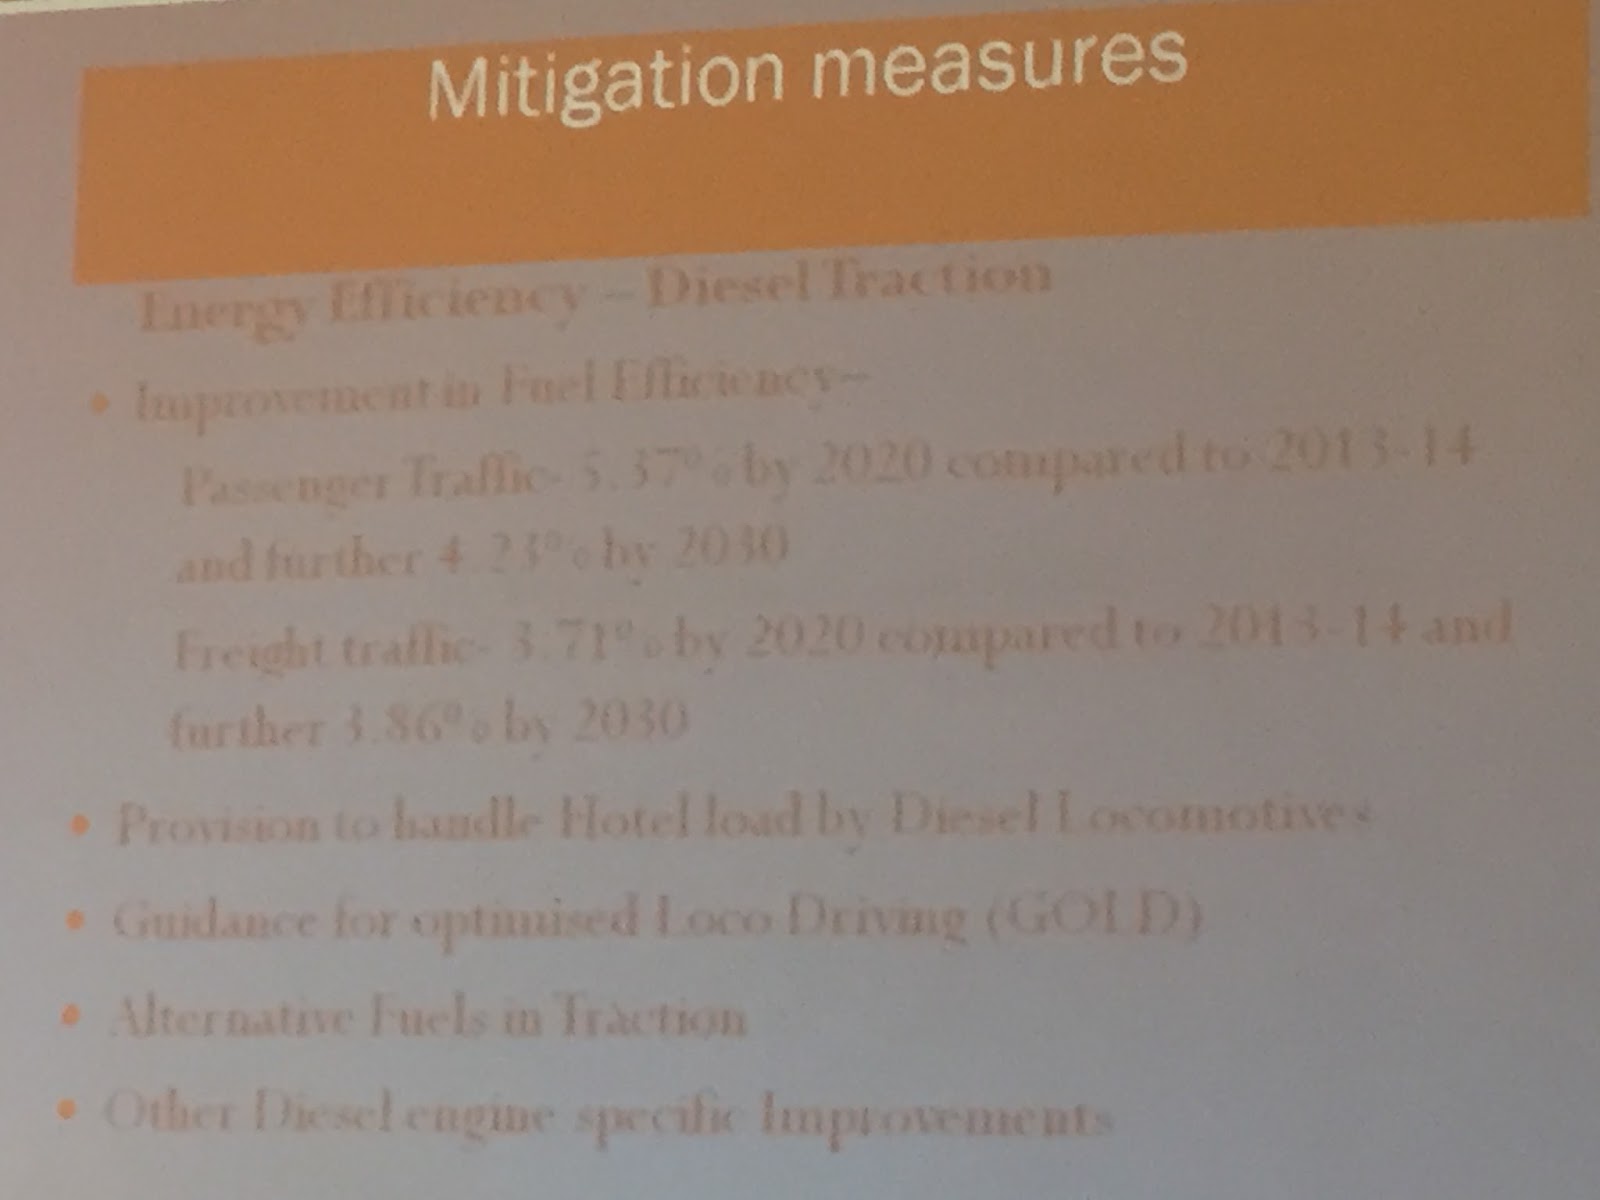
K Swaminathan
Advisor (Environment), Ministry of Railways, Government of India
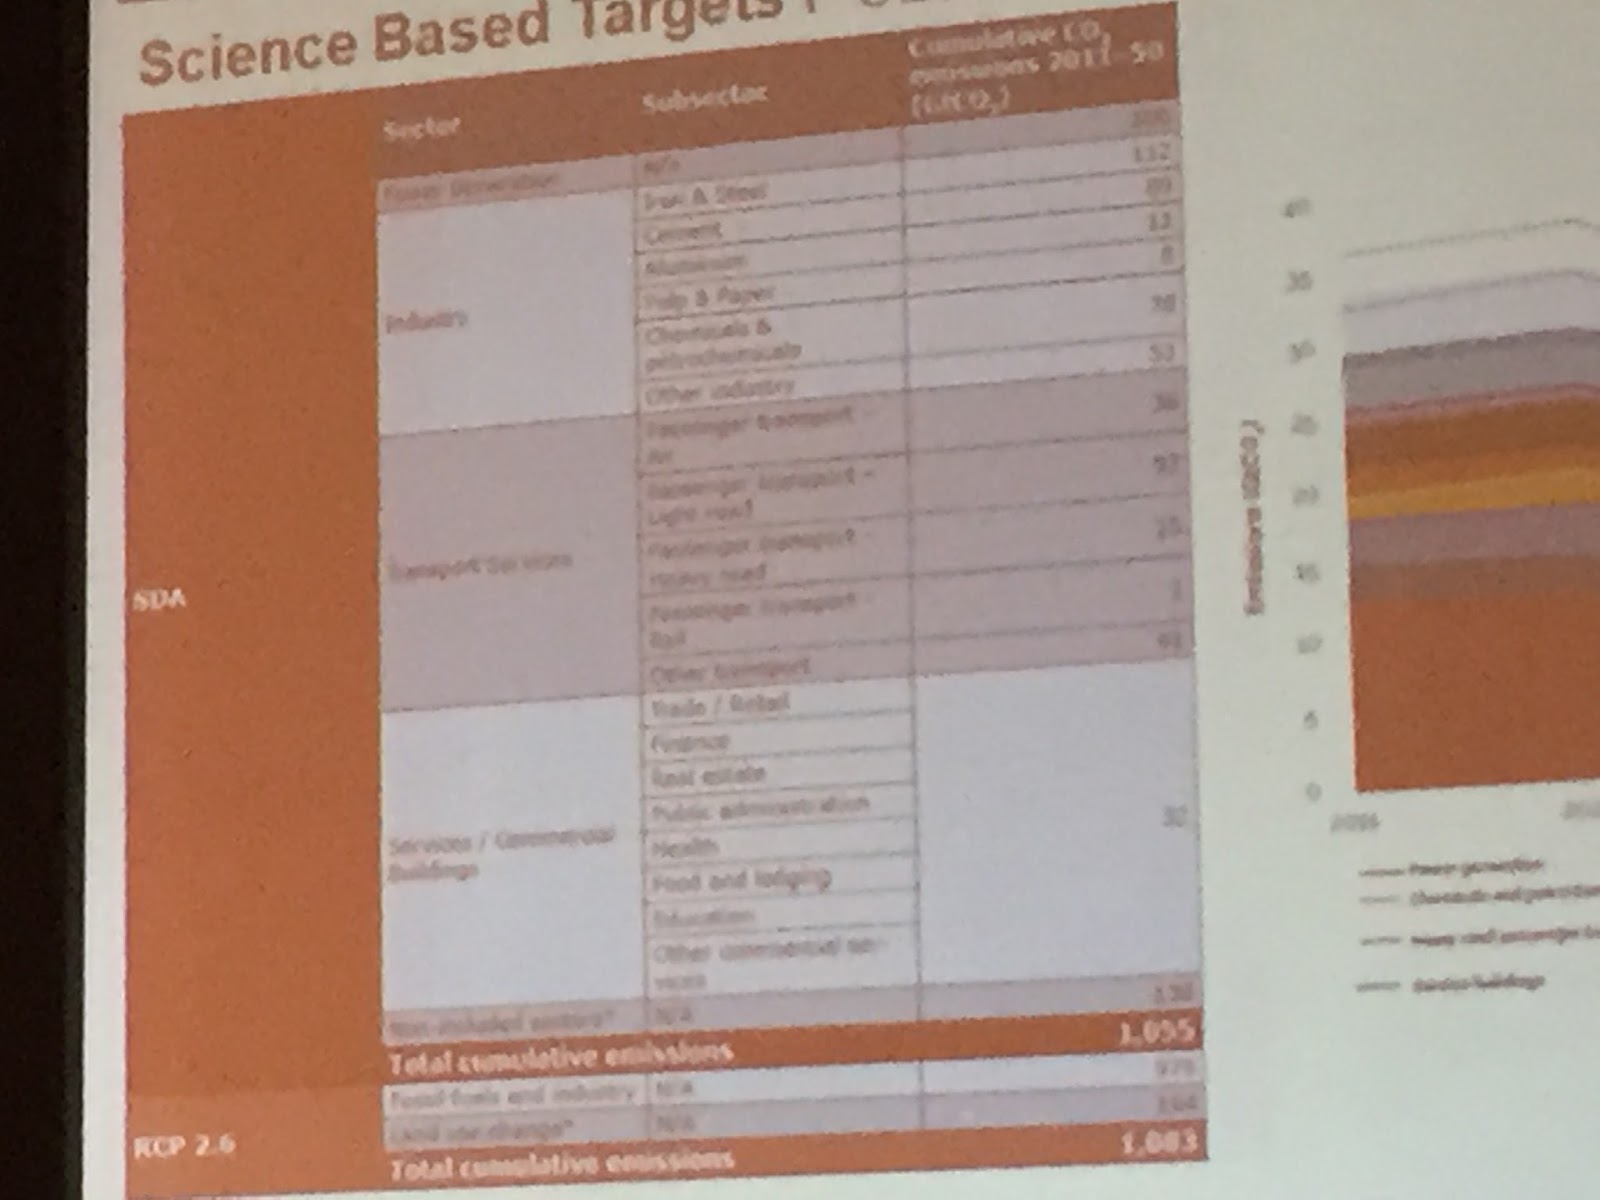
shared a series of slides with information about the transport sector and specifically the railways:
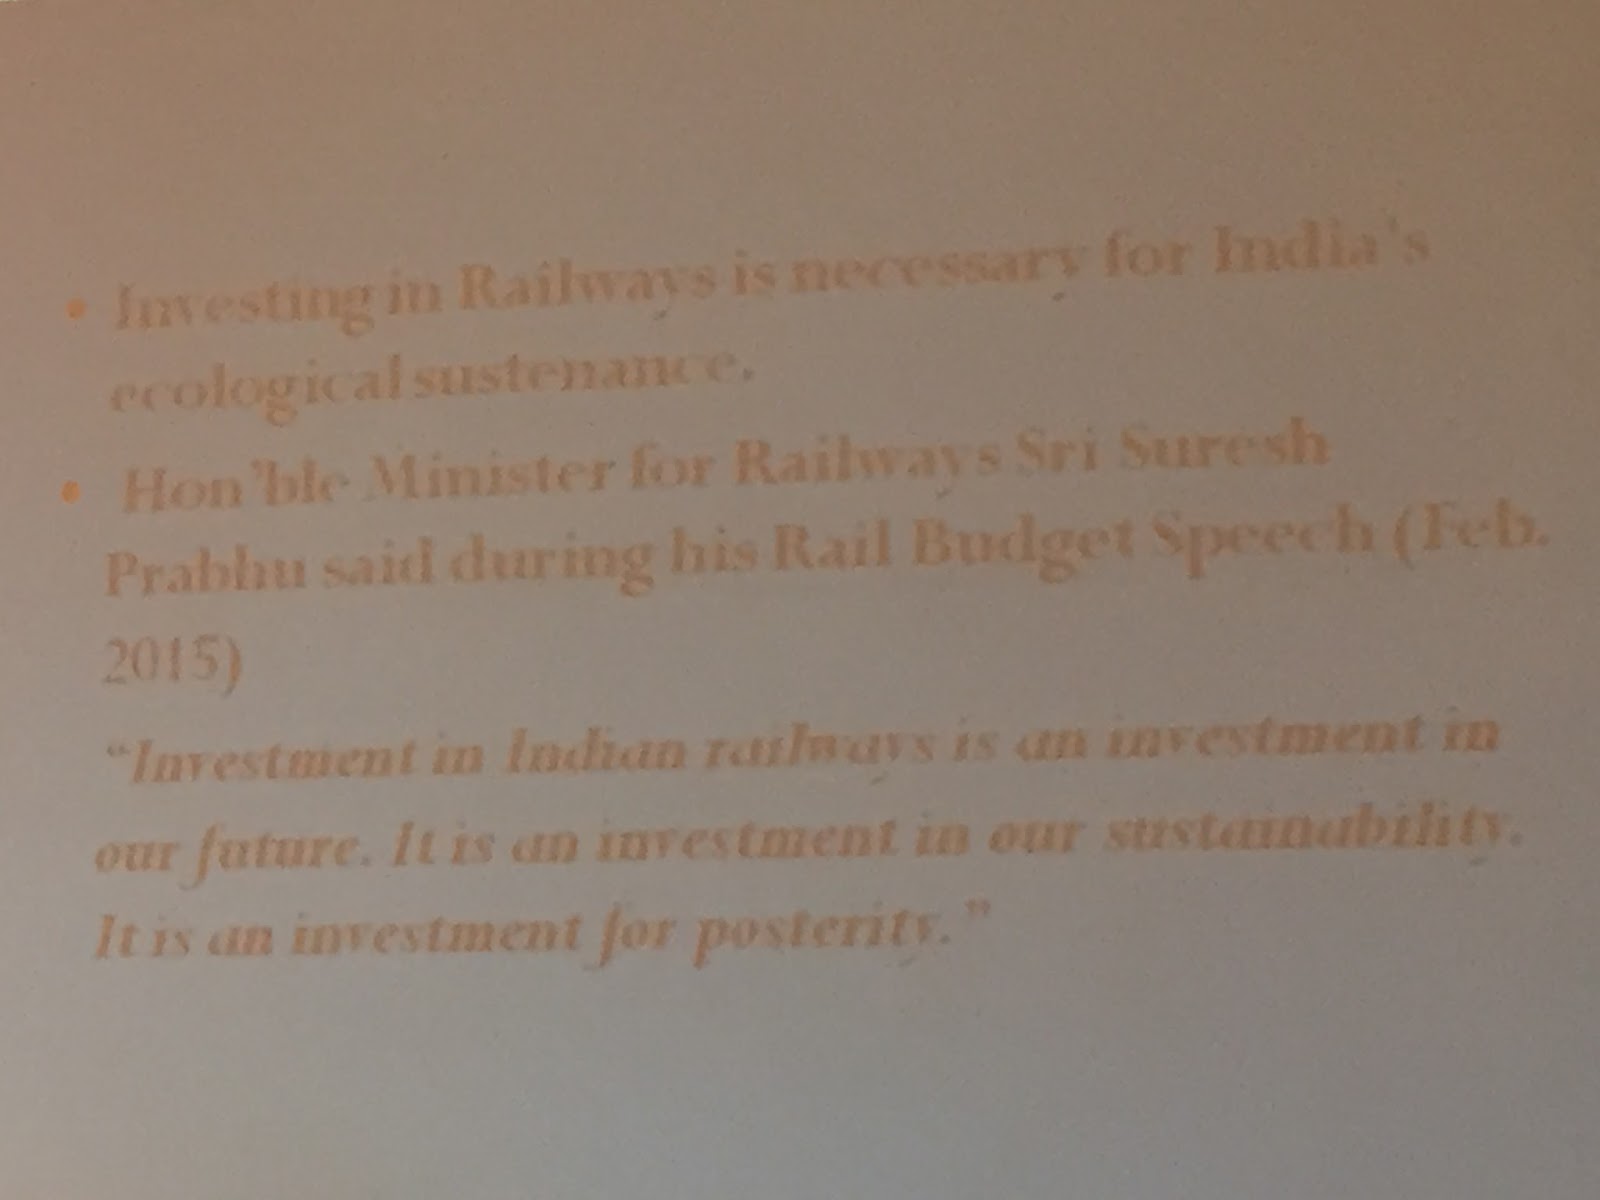
In case you can’t read it clearly, the quote says: “Investment in Indian railways is an investment in our future. It is an investment in our sustainability. It is an investment for posterity (all future generations of people).”
K. N. Rao
Director Energy & Environment, ACC Ltd.
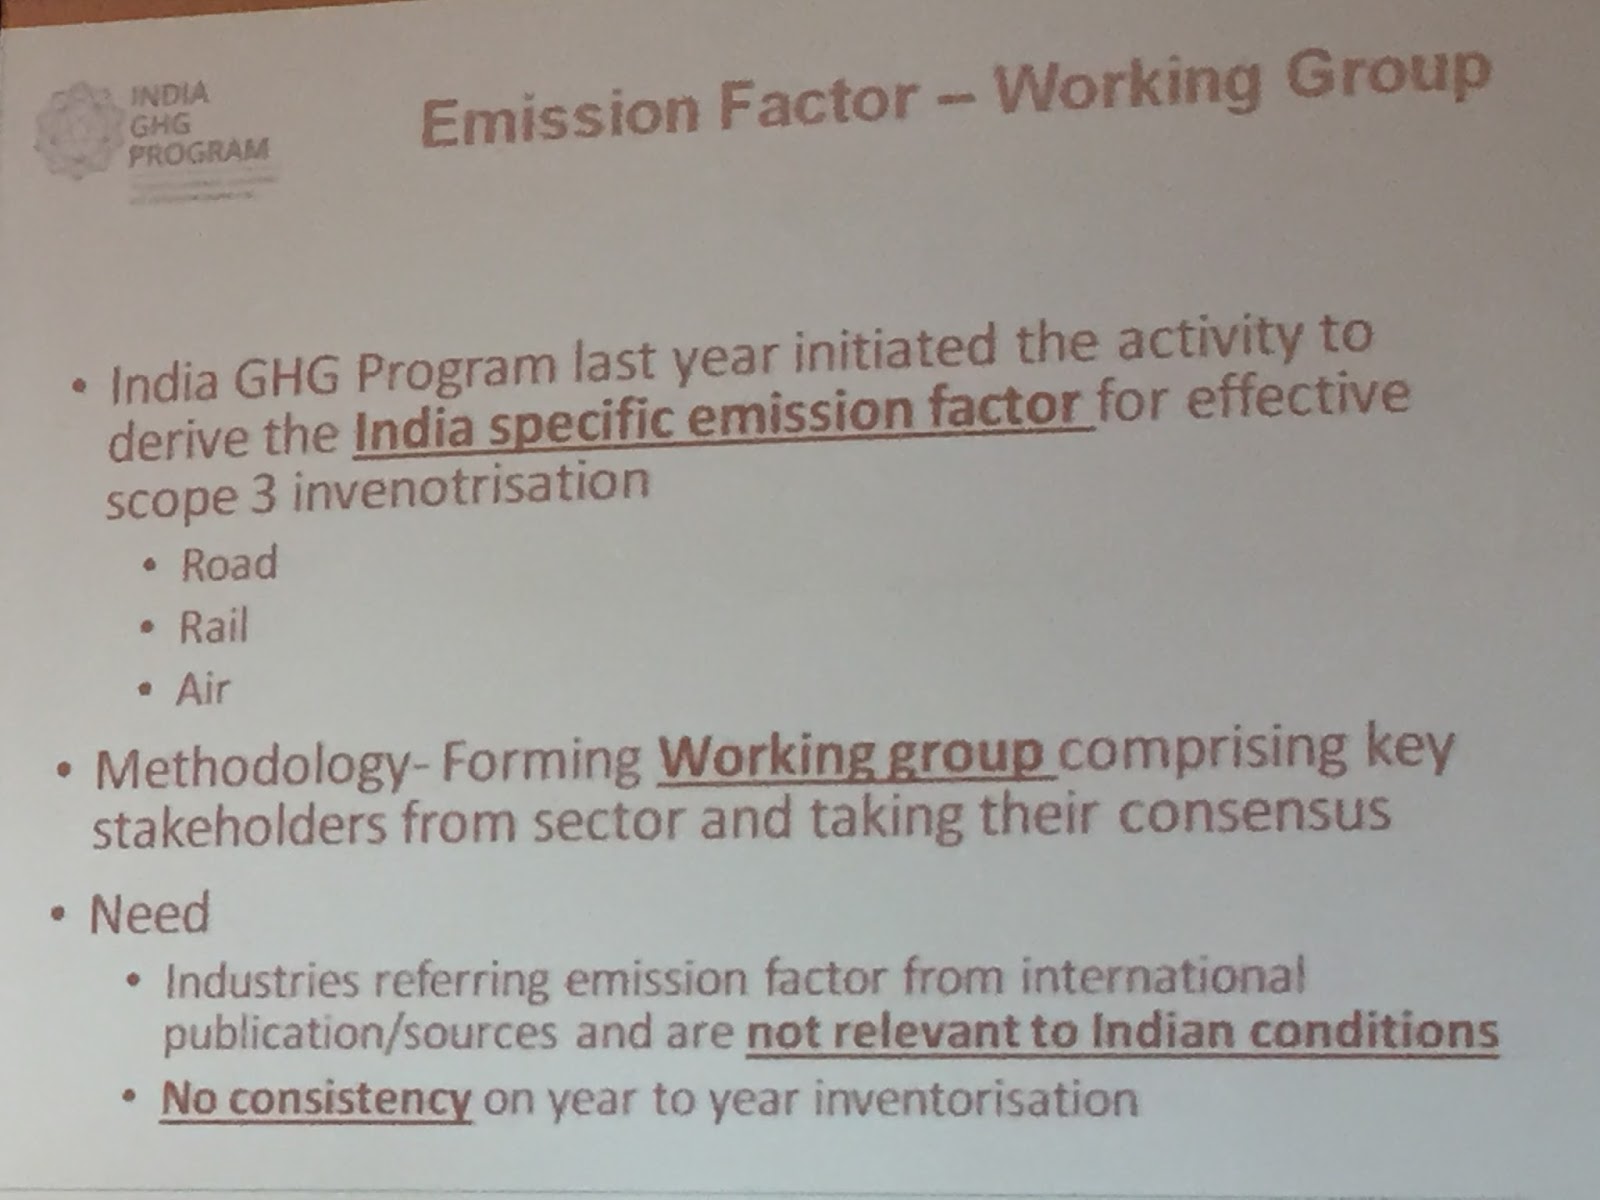
Launched transport emission factors. cBalance plans to work with the GHG program to share their work on India’s first and most comprehensive carbon emission factor database.
Then. the aviation specific emission factors were released. Here are a few notes on the aviation roadmap:
– Airline fuel saving opportunities led by the United Nations and theAirports Authority of India has resulted in 190 kg of airline fuel saving per landing.
– Bangalore Airport: commitment to generate 50% of power from renewables
Jamshyd Godrej, Chairman of Godrej & Boyce, spoke “If you don’t measure it you can’t do anything about it. Every ship puts 1000s of tons of grease into the sea. Climate change is, if not the most important issue, one of the most important – specially for India.
Thank you pointing out the temperature in the room (it was very cold).
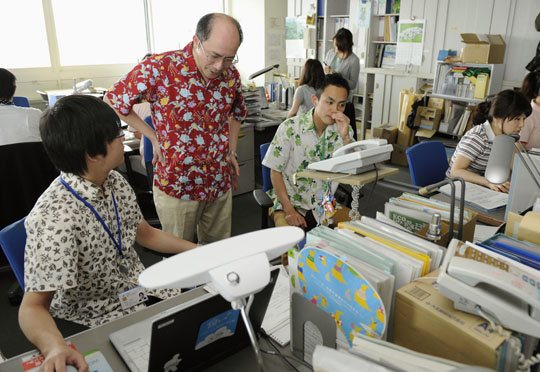
A one degree change in temperature can make a huge difference in energy savings. Prime Minister Koizumi, coined a term “Cool Biz” – you don’t need to wear suits to work and they saved billions of dollars in energy.
Japanese employees during the Cool Biz campaign that has been running every summer since 2005. It started off with government offices and was soon adopted by the private sector. All offices made their thermostat to 28°C. This idea was proposed by the then-Minister Yuriko Koike under the cabinet of Prime Minister Junichiro Koizumi. Initially the campaign was from June to September, but from 2011, when there were electricity shortages after the 2011 Tōhoku earthquake and tsunami it was lengthened. It now runs from May to October. Read more: Cool Biz Campaign.
Lawrence MacDonald
Vice President, Communications, World Resources Institute
“India didn’t create this problem. Rich industrial countries caused this problem.”
Shankar Venkateswaran
Chief, Tata Sustainability Group
“Carbon pricing is going to happen. The if question is off the table.
The biggest questions are: What will happen with that money? What will the price for carbon be British Columbia has 30 dollar a ton. Tax goes to middle income tax break, low income. Sweden has 100 dollar a ton.”
Learn more about British Columbia’s tax on carbon. It is considered one of the most progressive and equtiable tax structures as all of the tax on carbon is redistributed in individual or business tax breaks or to low-income people. Read more here: http://www.carbontax.org/where-carbon-is-taxed/.
Shankar Jadhav
Head Strategy, Bombay Stock Exchange Ltd
“Unless you measure something, and report it. Carbonex and Greenex. Samaan platform of BSE for environmental projects.” Samaan will be a portal for companies to browse through eco-projects that are eligible for CSR funding.
“$18-20, could be carbon price per ton in next 5 years. If you’re in a carbon intense industry, you should take note.”
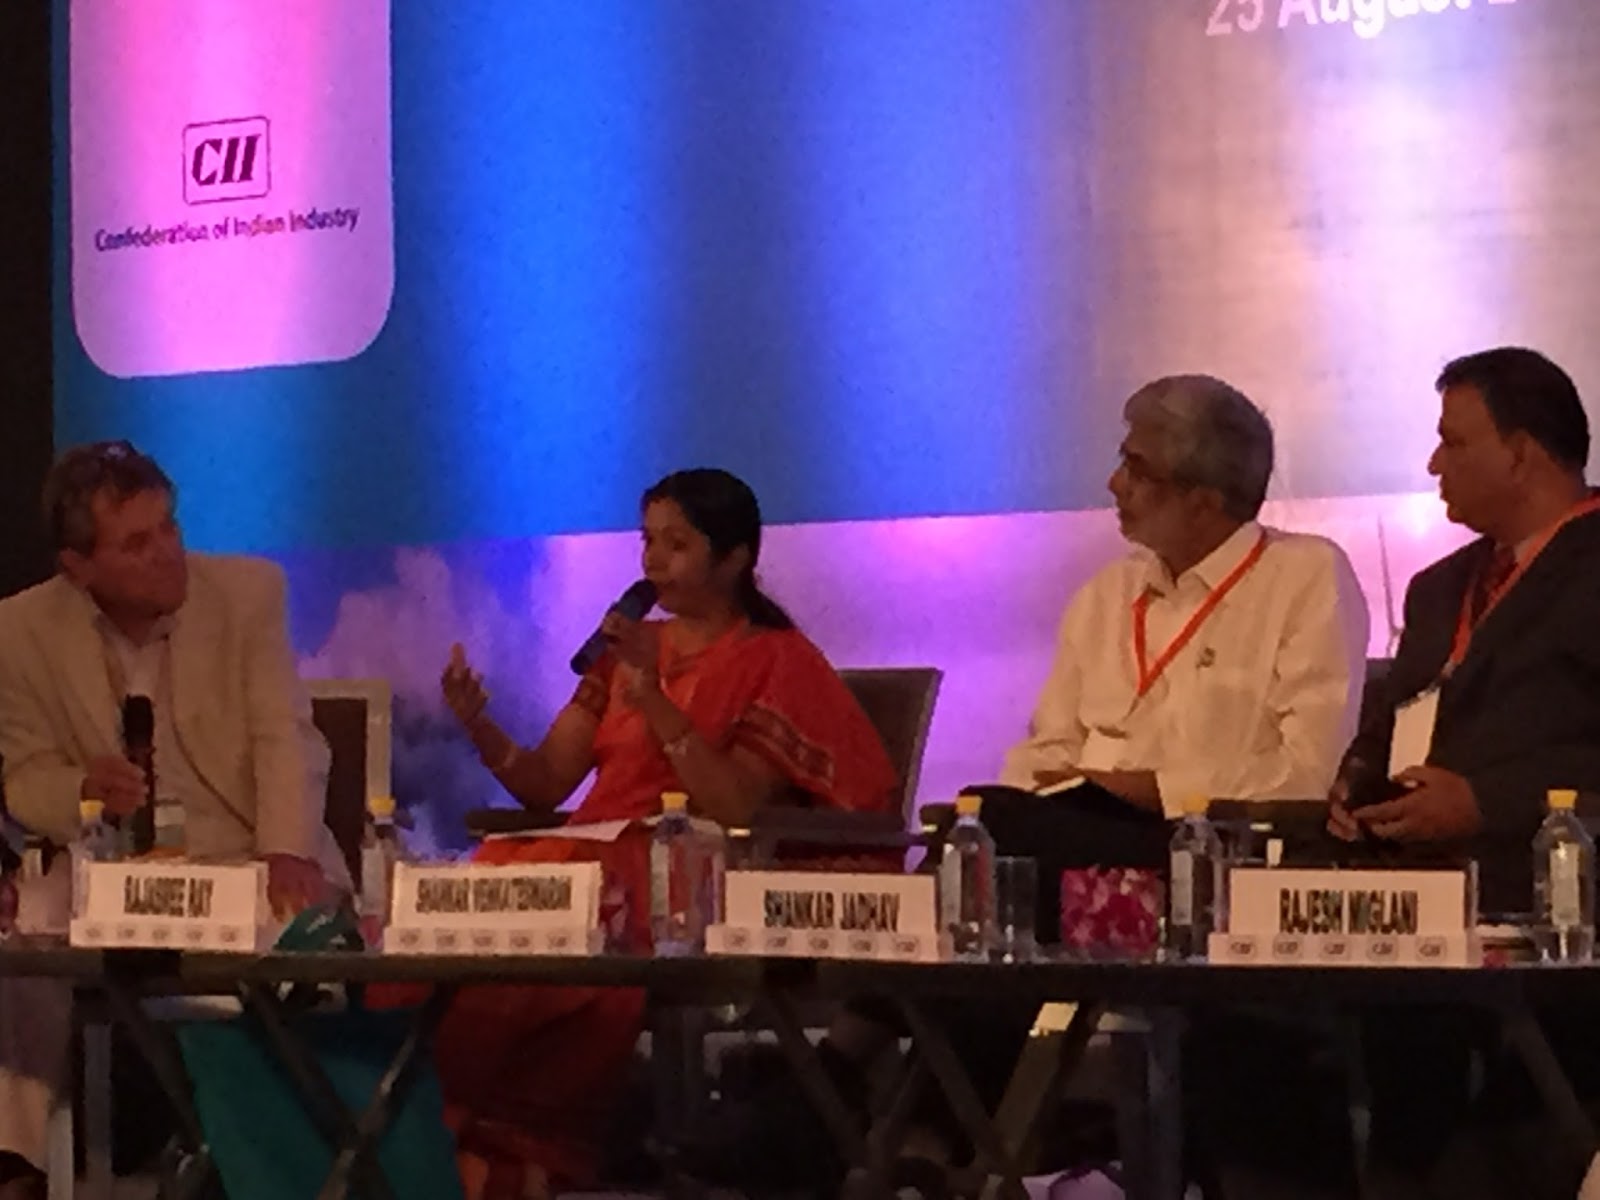
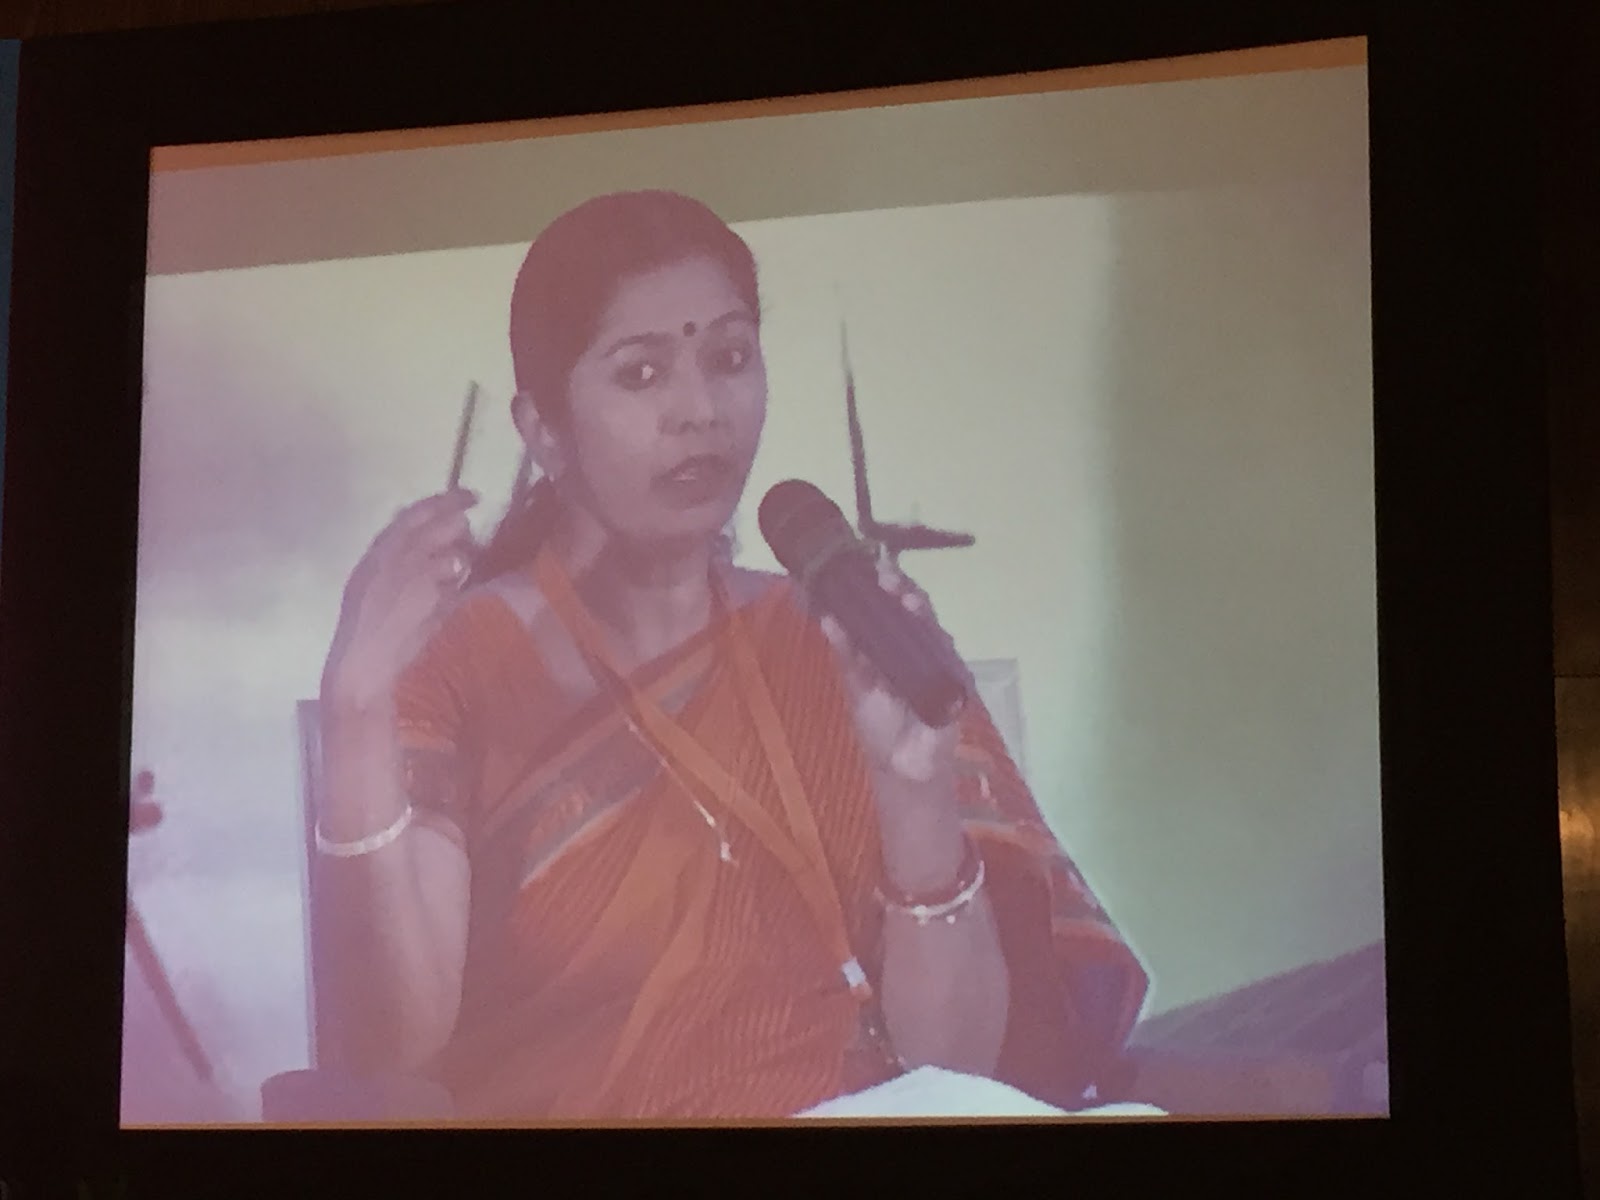
Rajasree Ray
Ministry of Finance, Govt of India
“I can say that we are in the final stages of Intended Nationally Determined Contributions (INDC). It will be more than the voluntary goal right now. We will evaluate a market mechanism to price carbon. There is also a Green Climate Fund – developed countries will give 100 billion dollars to developing countries. It has a country driven approach, balanced governance structure. 10.2 billon dollars already there and can be taken as a grant. We also have a national clean energy fund, adaptation fund, and national green fund. 15% of energy is used by 50% of people – 36% of that bottom 50% lives in India.” There is energy inequity in India. The FairConditioning program aims to make energy more equitable with a demand-side intervention in indoor-cooling in India.
Kevin Moss
Global Business Director WRI
“From the 90% of the companies that created the climate crises – 70% of the companies are oil and gas companies.”
Joe Phelan
Director, WBCSD India
Joe facilitated the next session with a very interactive style that allowed questions/comments from the audience.
ITC shared its goal to go for 50% for renewable energy. To ban multilayered plastic items. Due to transportation and storage.
Aditya Birla– Himanshu Nautiyal
“When you have a problem in a company you set up a committee or find a consultant. We accepted science based target because it is industry based.”
Dr. Reddys
“Linked HVAC system into the BMS and gave us 40% energy savings
– Oxygen analyzer for complete combustion
– Coal-fired boiler
– Optimization of 60% of carbon is from scope 3
– We need to go for Sustainable sourcing”
Tech Mahindra
“Each employee goes through a test on sustainability before joining. What has the return been? Employee engagement has the highest return and it increases attrition. For us what really matters is scope 3”
Tobias F. Dorr
– GIZ, German agency for sustainability development
-Working in India for 60 years
– 145000 tons of waste every day
– 60% are collects
– 20% treated
CEM
– 3500 projects approved by ministry of environment
– Price broke down
– Use municipal solid waste as RDF
– Guidelines missing
Rajasekar
Executive President, UltraTech Cement Ltd.
– Developed the IES Cement Sector roadmap
– Benchmarking platform like the Carbon Disclosure Project (CDP)
– Getting the numbers right for Cement Sector
How do you benchmark your data on carbon?
Carbon Capture and Usage: An interesting topic of conversation that came up is this idea of Carbon Capture and Usage, not Storage. This could be quite relevant.
Mahindra and Mahindra
Anirban Ghosh – Vice President- Group Sustainability, Mahindra & Mahindra
“Biggest level of impact is to reduce the distance between the suppliers and us.”
Indus Bank
Adwait Hebbar – Head Corporate Services, IndusInd Bank
“It was tough to change the mindset, people would ask questions like:
How does it matter if we’re printing 50 pages?
How does it matter if we’re using the AC?
So we asked how can challenge that?
Scope 3:
Can we have our board meetings tele-conferencing?
Can Investment bankers fly less and do more tele-conferencing.
Do we give preferential rates of lending for environmental friendly companies? Probably not.” However, just by asking this question it seemed like he was insinuating that in the future bank may ask for your environmental record before giving you a loan.
Jain Irrigation
Dr Santosh Deshmukh
– Largest processor of Mangoes in the world
– 3rd largest processor of Onions in the world
– Life cycle assessment, case studies for Onion
– Our organizational goal is to leave this world better than we found it
– Implemented Jain GAAP
– Advice: do incorporate the impact supply chain can have
Some ideas I had while attending the convention:
– Godrej Foundation could become a partner of the FairConditioning program.
– cBalance could do the water audit for the Indian Railway
– cBalance should start doing internal carbon accounting and reporting to be a role model
Investment, time or money, in climate change mitigation is an investment for posterity. If you are alive, you have power – with great power comes great responsibility.
If you have any questions/comments, feel free to reach out to me at dhruv@cbalance.in.
This report presents state wise emission factors for electricity generation as well as their respective AT&C losses. To enable accurate calculation of emissions by end users in each state the two factors are also combined to present an emission factor for end user consumption of electricity in each state in India. This report, brought out by cBalance Solution Pvt. Ltd., also highlights comparative emissions of all states taking into account each ones specific emission factor which with further analysis can be used as a tool for progressive national policy making in order to help India achieve its goal of 20-25% emissions reduction from 2005 levels by 2020.
1.1 STATE OF THE POWER SECTOR IN INDIA (2009-10)
Though the total ex-bus energy availability increased by 8.0% over the previous year and the peak met increased by 7.5%, there were still significant shortages in the country both in terms of both energy and peaking availability as given below:
Energy (MU)
Peak (MW)
Requirement
8,30,594
1,19,166
Availability
7,46,644
1,04,009
Shortage
83,950
15,157
% shortage of requirement
10.10%
12.70%
The energy requirement registered a growth of 6.9% during the year against the projected growth of 8.2% and Peak demand registered a growth of 8.5% against the projected growth of 8.2%.
1.2 State wise contribution in electricity generation and consumption
About 50% of states & union territories are not self sufficient in electricity generation and are dependent on others states to fulfill their requirements.
Maharashtra is highest generator and consumer of electricity with Gujarat, Andhra Pradesh and Tamil Nadu close behind. Chattisgarh exports the largest amount of electricity at 4941 GWh while Tamil Nadu imports 4046 GWh which is the highest in the country.
2. Scope and Methodology
The data is sourced from CEA reports and calculations are done as outlined in the IPCC 2006 guidelines.
Electricity generation factor (kgCO2e/kWh)
(Emission from fossil fuels used for generation + Emission from electricity imported from other states – emission from electricity exported to other states) / Total electricity consumed by state
Fossil fuel electricity generation technologies include coal, thermal, Gas turbine generation and Diesel Generators.
Emissions from renewable energy technologies are considered to be zero.
AT&C Losses factor (kgCO2e/kWh)
(Total electricity generated by state x adjusted electricity generation factor of state x % of AT&C losses in the state)/ Total electricity consumed by state)
Adjusted generation emissions are Total electricity consumed * emission factor adjusted for import and export of electricity
The following results stand out from the above table:
Jharkhand has the highest emission factor for generation at 1.21 kgCO2e/kWh and also the highest emission factor after adjusting for import and export of electricity which is 1.33 kgCo2e/kWh
2. Bihar has the highest AT&C losses in the system due to which it has the highest emission factor for AT&C losses which is 0.86 kgCO2e/kWh. This also results in it having the highest emission factor for end user consumption of electricity at 2.1 kgCO2e/kWh.
3. The average India electricity generation emission factor is 0.89 kgCO2e/kWh and average India AT&C loss emission factor is 0.30 kgCO2e/kWh.
4. States that import electricity are liable for the corresponding proportion of emissions of each state from where electricity is imported. Hence some states like Sikkim, Assam, Manipur, Nagaland in particular appear to be “dirtier” i.e. their emission factors are quite high because they are importing electricity from states which have a high electricity generation emission factor.
3.2 State wise end user consumption emission factor of electricity
Graph 1: State wise end user electricity emission factor
In the above graph we can see almost 45% of states have an end user emission factor that is higher than the India avg. emission factor of electricity generation.
In many cases we can see that states have a low adjusted emission factor for generation but due to high AT&C losses their end user emission factor is higher than the India avg. emission factor. This point is illustrated in detail in the graph below.
3.3 State wise AT&C losses and emission factors for AT&C losses
Graph 2: State wise AT&C % losses and AT&C loss emission factors
As shown above the India average AT&C % loss is 25%. Also there is a big variation in the % losses between the grids specifically such as the South grid and NEWNE grid.
Highest AT&C % loss of 67% is recorded from Jammu & Kashmir and the lowest one recorded from D.&N. Haveli which is 11%.
About 40% states have higher AT&C system losses than the India average which points to a huge potential to save electricity with up gradation of technology and proper maintenance of transmission and distribution systems. It is also noticeable that states with difficult terrain such as hills and forests have higher AT&C losses than other states.
Another important fact visible in the graph above is that the AT&C loss emission factor is not only dependant on the quantum of losses but also on the source of electricity generation. Hence a state with low AT&C losses but “dirtier” sources of electricity generation could still have an AT&C emission factor higher than that of a state with higher losses but cleaner sources of generation. For e.g. Arunachal Pradesh has extremely high losses of about 47% but since most of its electricity is generated through hydel power its AT&C factor is less than 0.1 kgCO2e/kWh. Whereas Jharkhand has losses of only about 23% but its AT&C emission factor is about 0.3 kgCO2e/kWh since most of its electricity is generated from coal.
3.4 State wise contribution in electricity generation and emission from electricity generation
Graph 3: State wise % contribution in total electricity generation and % contribution in total emission from generation of electricity (all sources)
In the above graph we can see that a majority i.e. 23 states and UT’s contribute less than 1% each to India’s generation and emission stock. The majority generators are Maharashtra, & Gujarat and they are responsible for 9.2% and 6.8% of generation stock and 10.2% and 6.3% of emissions respectively.
Karnataka also has the lowest percentage of emissions of 2.9% with respect to it percentage of generation stock of 4.7% while Uttar Pradesh has the highest percentage of emissions of 4.3% over its percentage contribution to the generation stock at 3.3%.
4. Conclusion
A majority of emissions from the power sector are due to usage of coal as a primary medium for electricity generation (68%). There is a large potential to reduce emissions through usage of better quality of coal, more efficient technologies as well as moving to cleaner technologies such as thermal, hydro, solar etc. But these scenarios depend on various factors such as cost, geographical location, availability of raw materials etc and hence are hard to predict.
But as shown earlier, states with relatively clean generation technologies still have quite a poor end user emission factor due to major AT&C losses. This is a “low hanging fruit” opportunity for states to drastically improve their quality of electricity and emission factors. For e.g. if all states whose AT&C losses lie below the India avg. of 25% move up to atleast the average, an emission reduction of approximately 15 MTCO2e is possible. In the best case scenario if all states improve their efficiency of AT&C to the world average of 8.4% phenomenal savings of 115 MTCO2e are possible which is a reduction of about 67% of emissions due to AT&C losses. These steps can go a long way in helping India achieve its goal of 20-25% reduction in emissions over 2005 levels by 2020.
[1] Data Source : CEA – All India Electricity Statistics – General Review 2011
[2] Data Source : CEA – All India Electricity Statistics – General Review
2011
[3] Chandigarh is exporting more quantity than total generation so on the conservative principal assumed that one State whatever is importing within that it is consuming electricity embedded with higher emission.
Diu Electricity GHG EF (except AT&C Loss GHG EF) is same because it has been calculated on combined level due to non availability of quantity of exported and imported electricity.
[5] Sikkim is exporting more quantity than total generation so on the conservative principal assumed that one State whatever is importing within that it is consuming electricity embedded with higher emission.


")

")

")

, Beer Bottle: Total avoided emission (per piece of beer bottle)")
")