“What is ‘enough’ in construction and even in life in general? What are we looking at in terms of impact when we construct a massive glass building in the middle of tropical cities like Pune or Mumbai or Bangalore? Are we just constructing something that gives us a panoramic view of the city and serves no other function?Isn’t this similar to spending crores on making an oven and then spending crores more to refrigerate it?”
These are the questions Mr. Nilesh Vohra, a young builder of Kanchan Developers, Pune was asking himself after a conference on ‘Defaulting Green’ in Kerala a few years ago. Nilesh is part of theGreen Buildings Committee of the Pune chapter of a nationally recognised builders association in Indiaand met inspiring green building consultants and developers through this forum. These are his initial manoeuvres into responsible construction practices.
Nileshs’ questions draw attention to the need for constructing buildings that are not solely driven by social notions of a ‘premium’ building (in this case, glass buildings), but also consider the social, economic and environmental implications of designing such buildings, which when not considered are detrimental to society and the environment as a whole.
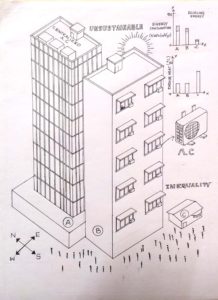
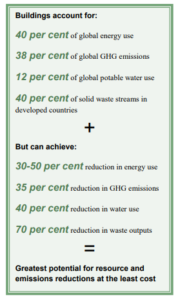
Why should the building economy consider moving towards green building construction, immediately? [footnote-(fn1)] In an era of human-induced climate crisis (fn2), we need to limit global warming to less than 1.5°C above pre-industrial levels, since estimates state that an increase in temperatures beyond 1.5°C will accelerate the climate crisis, resulting in increased unpredictable and uncontrollable occurrence of disasters such as floods, droughts, biodiversity loss, cyclones, etc. These episodes impact vulnerable sections of society in-equitably; not only are those from economically poorer backgrounds impacted first, but women, children, the elderly and sick are also vulnerable. Everyone, irrespective of who we are, will bear the consequences of climate collapse. The damage to buildings and other property, goes without saying, too. In order to avoid such damage, climate scientists caution towards reducing our greenhouse gas (GHG) emissions by 45% before 2030 and reaching net-zero emissions by 2075. The role of the building economy in contributing to GHG emissions and its potential to mitigate it are stated in the image (UNEP, 2012).
If constructing a ‘safe’ building is a non-negotiable value , considering the implications of the building economy on the environment, can green buildings be an option or are they a necessity?
According to India Brand Equity Foundation (2018), the number of Indians living in urban areas will increase from 434 million in 2015 to about 600 million by 2031, increasing the demand for residential and commercial buildings, both. Recognising the projected increase in construction activities, there seems to be ample opportunity to move towards responsible green building construction. Easy to say “Construct green buildings.” but how do we go about constructing these? What are the steps we have to take to implement these ideas in reality? How do we encourage and support the likes of Nilesh Vohra in making these a priority, amidst all the other logistical and bureaucratic challenges of building in these times? Based on our experience with carbon footprinting and ongoing dialogue with stakeholders contributing towards building construction, we offer some perspective that can facilitate the move forward.
Carbon Footprinting: A means towards responsible construction
What is carbon footprinting and how is it useful? Carbon footprinting is a measurable, verifiable and comparable instrument that entails measuring the carbon emissions during different operations and activities, in this case, building activities. This supports identifying alternatives to reduce emissions and where these would be most effective, thereby minimizing the negative impacts of construction on the environment. By quantifying carbon reduction efforts in building construction, meaningful and comparable information can be shared with building sector counterparts as well as potential buyers creating a base of evidence and commitment towards responsible construction. Carbon footprinting of building projects is a means for builders to begin demonstrating care for the larger world we belong to.
Just as one would not simply measure blood sugar levels of a diabetic without the intent to reduce them, responsible building, therefore, does not end with measuring the carbon footprint of a project. Incorporating actionable steps to mitigate emissions that are avoidable is the most important part.
The cBalance Carbon Footprint Experience
We supported carbon footprinting of the Royal Orange County Residential Housing Project as well as for two townships of Lohegaon and Zandewadi in Pune, respectively. Besides this, internal capacity building and skill development for the Orange County Foundation team was conducted to equip them with skills for calculating the carbon footprint of their construction projects. [Links to detailed reports of the three projects mentioned, are given in a box below. An overview of learnings from engagement with carbon footprint projects is provided at the end of this section, too.]
In the case of Orange County, a comparison was made between their previous projects and the Royal Orange County (ROC) Residential Housing Project which incorporated low carbon efforts such as eco-friendly architectural design buildings, renewable energy, waste management, wastewater management and low-carbon embodied construction and building materials. The calculation of the carbon footprint of the construction phase by the Orange County team revealed 15% lower emissions for the ROC construction compared to their previous projects. It should also be noted that Orange County incorporates sustainable principles in its construction projects by default and comparing the life cycle carbon footprint (fn3) of the ROC with other builder projects in Pune would probably demonstrate a much larger difference in emissions.
In the case of Lohegaon and Zandewadi townships in Pune, Maharashtra, we were asked to conduct carbon footprinting at the request of VK:e environmental, an architecture consultant. The project builders were required to submit a carbon footprint projection report including measures they would undertake to mitigate emissions to the State Environment Committee (SEC), Maharashtra prior to the start of the project. At the time, there wasn’t a standardized protocol available for township carbon footprinting (currently a GHG Protocol for Cities is widely used), so CB used multiple protocols to ensure quality measurements. This was undertaken considering that multiple iterations of footprinting using different protocols would lead to similar conclusions which would strengthen belief in the mitigation recommendations that would be suggested.
Following were the findings after conducting life-cycle carbon footprints of the two townships:
Township
Emissions
Mitigation Potential
Business As Usual (BAU)
Low carbon scenario
Lohegaon
3.51 million ton CO2e
2.48 million ton CO2e
1.02 million ton CO2e
Zandewadi
3.15 million ton CO2e
2.24 million ton CO2e
0.90million ton CO2e
Recommendations were conveyed to enable the builders to incorporate low carbon measures during the building process. Few of the recommendations that were suggested include: 1. Using natural afforestation methods rather than conventionally used plantation-forestry methods to compensate for the carbon absorption capacity that would be lost due to irreversible damage caused to the land on which the construction would occur. This recommendation suggested planting native trees and using the Miyawaki method of afforestation. 2. Reducing energy consumption by integrating passive design techniques such as the use of thermal mass to reduce heat gain, insulating materials or cavity walls, appropriate shading strategies for fenestration, low-U glazing, low-E films, and heat-reflective paints. 3.Inclusion of structure and radiant cooling systems within all floor and ceiling slabs to mitigate solar heat gain through rooftops and walls. 4. Designing flats in a manner that enables integration of natural refrigerant-based split ACs should the flat owners choose to install an AC.
Illustrations of Passive cooling strategies.
In comparing the projects; Orange County through implementation of low carbon measures actually demonstrated mitigation gains, whereas in the case of the two townships only the potential mitigation gains were revealed. Thus, while we participated in SEC hearings to encourage the SEC to approve the carbon footprint report and clear the township projects only if the builders take steps that align with the recommendations made, this was the extent of our influence. It still remains the purview of the SEC and other industry boards/ government authorities to compel builders to implement actionable steps towards reduction, compared to BAU construction.
Way forward
If the potential for environmental safeguarding during construction is no longer in question, then other factors must influence the decision to do so. What would make it accessible and worthwhile for builders to carry out these activities? According to Nilesh two critical obstacles for builders are the lack of investment in the sector and the lack of demand from end-users. For both, carbon footprinting presents itself as a step towards addressing these gaps.
An open disclosure tool, similar to other online tools, requires users to merely submit relevant data, which is then automatically processed to display the final results. Such a tool would enable multiple builders to present their carbon footprint calculations which would essentially create a feedback loop that shows where buildings can undertake at least the well-known measures to control carbon emissions such as using local materials, ensuring energy reduction during the operations phase, conservation etc. A life cycle carbon footprint additionally shows not only the savings at the time of construction but also the potential future energy and emissions savings (during occupation). Last, but definitely not least, it also shows where sustainable solutions pay back over time even those that may initially cost more. With such data it is possible to show investors and government and regulatory bodies from the local municipal level right up to the national and international levels, that such benefits can and should be tied to decision making and evidence-based policy making that favours and rewards responsible construction.
CBalance can create an affordable, sensitive and user-friendly tool and would invite industry associations such as the Confederation of Real Estate Developers’ Associations of India (CREDAI) to collaborate in this to encourage an increasing number of builders to voluntarily engage in carbon footprinting. This, along with recommendations based on the marginal abatement cost curve, can give builders a range of emissions mitigation opportunities from the least cost option to the highest cost. Additionally, our experience with building in-house capacity for carbon footprinting itself with the Orange County team showed that this too was not difficult. Thus, we recommend using a standard protocol for measurement and coupling in-house capacity building and engagement with consultants who are experienced in the field, to provide appropriate mitigation measures.
At this stage, it is in the collective hands of the builders to push for responsible construction processes at a larger scale, benefitting both, the building economy and the planet as a whole. If they have the vision and will to do so, carbon footprinting and cost-efficient sustainable alternatives like passive design techniques can easily replace ecologically destructive and expensive practices like air-conditioned glass buildings. Builders like Orange County have found ways to translate the wide variety of benefits it holds for residents and the wider community. Ultimately, raising the level of demand for responsible construction from multiple quarters can make shared responsibility and accountability a grounding and enlivening force for the building economy rather than an unwanted burden to be passed off or signed off on at the first opportunity. It will take many more Orange Countys and many more young builders like Nilesh to tip the scales and make sustainable the default. Whether you’re a builder, business person, government official, concerned consumer or citizen, at this juncture in time with climate chaos knocking at the doors of each one, which way you choose to step or what you choose to put your weight behind may change the course of not just your life but the nation and the planet too.
(1) A green building incorporates design techniques, materials and technologies that minimize its overall impacts on the environment and human health. This is achieved by better siting, design, material selection, construction, maintenance, removal, and possible reuse. Main outcomes are minimum site disruption, reduced fossil fuel use, lower water consumption, and fewer pollutants used and released during construction, occupation and disposal of the building. (UNESCAP, 2012)
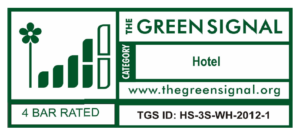
The Coconut Lagoon Heritage Resort in Kumarakom, Kottayam district, Kerala commissioned the Green Signal to provide it with an ecolabel rating, which was determined to be 4 bars out of 5.
The ecolabelling process is based on these three areas of investigation, verification, and documentation: GHG inventory assessment of the hotel (with respect to energy, water, waste, mobility, and materials), the conservation practices (of materials, waste, water, and energy) within the hotel, and the sustainability initiatives promoted/operated by the hotel.
Consolidated Activity Data and GHG Inventorying – FY 2011-12
Total annual GHG emissions: 1210.9 MT CO2e/year
Total annual overnight stays for FY 2011-2012 is 10,138, and the GHG emissions per overnight stay (all emission scopes) is 119 kg C02e/overnight stay:
Only taking into account Scope 1 and 2 emissions, the GHG emissions per stay are 106 kg CO2e/overnight stay, meaning that Coconut Lagoon has lower GHG emission than 87% of 5 star hotels in the Warm & Humid Agro-Climatic Zone.
Positive Environmental Impacts
Waste Reduction and Management
Waste Reduction:
-Paper reductions – newspapers aren’t delivered to each room; rather there’s common reading material provided in congregation areas. Reusable cloth bags are used as bin liners in guest rooms.
-Plastic reductions – Use of plastic packing for supplies coming onto the property by vendorsis prohibited (vendors are required to package material in reusable containers/jars). Bottled water suppliers are asked to take back empty PET bottles, and soap/shampoo containers are made from terracotta.
-Other – Organic paddy cultivates eliminates the use of fertilizer and pesticides and reduces water use.
Low Embodied Carbon/recycled materials:
-Recycled paper is used for all communication materials, guest amenities, and restaurant menus.
-The on-site school for the staff’s children is built from recycled PET bottles.
-90% of BUA is comped of re-assembled ‘Tharavad’ houses.
-All laundry detergent, soaps, and shampoos are biodegradable (so that wastewater treatment plants work properly). Organic pesticides are used rather than conventional ones.
Biodegradable/non-biodegradable waste:
-Cooking waste is processed by conversion into methane by a biogas plant.
-Dry leaves are composted in bamboo bins using slurry from from the biogas as a bio-catalyst, and the resulting compost is used for farming.
-Coconut husks and other organic materials not suitable for biogas processing are composted on-site and then used for farming.
-Non-biodegradable waste is segregated and sold to scrap dealers for recycling; near 100% recycling is achieved for the majority of waste categories.
-Paper waste is recycled for envelopes, and construction material refuse is used for the construction of walking pathways. Old cloth refuse and bed linen are donated to local orphanages.
Water related practices
-Wastewater is treated by a sewage treatment plant using Expanded Granular Sludge Bed Reactor (EGSBR) and filtration technology and the effluent is used for gardening purposes.
-Push-taps are installed in staff quarters and messes and guest bathrooms are equipped with dual-cistern flush systems reduce water consumption. Instead of a conventional lawn, an indigenous variety of Buffalo Grass is used that requires less water, curbs evaporation, and enhances groundwater recharge.
-Rainwater harvesting means that Coconut Lagoon’s operation during monsoon season is entirely water self-sufficient (additional water–2700 kilos–is sourced from tankers only during the summer months of March to June).
Energy related practices
Energy efficiency:
-Lighting is more efficient because CFL bulbs are used in the gardens, and LED and T5, T8 tubelight fixtures with electronic ballots are used elsewhere.
-HVAC – the use of 30 TR VRF systems account for 22% of the total tonnage, and 28 split-unit systems of 2.2 TR capacity have an EER greater than 2.92.
-Has naturally lit and naturally ventilated restaurants; all guest rooms and bathrooms are designed to maximize natural light and ventilation.
-Capacitor banks are installed to achieve power factor improvement; power saver technology is used in all 50 rooms.
Renewable Energy Practices
-A solar thermal network supplies the hot water requirement (13,000 liters per day) for 50 guest rooms and the kitchen.
-A 2kW Solar PV on one of the guest transport boats comprises 0.50% of total connected load.
-A biogas-run cooker, running on methane from the biogas plant with a calorific value equivalent to 17kgs of LPG a day, can cook 80 kgs of rice per day. Excess methane from the biogas plant and EGSB reactors not used for cooking purposes is used to power street lamps that would have a combined load of 500 watts under normal conditions.
Sustainability Practices
Food Procurement Practices
-59.47% of annual food procurement cost comes from within the state, and 0.46% annual food procurement is spent on organic food.
Economic, Social, and Environmental Development Practices
-80% of unskilled labor comes from the community, and cloth laundry bags, paper bags, envelopes from newspapers, and terracotta waste bins are all manufactured locally.
-Coconut Lagoon has adopted two local schools and financially supports their maintenance work, station, and study materials and resources.
-Waste bins are provided for the 180 families (1 per 10 families) in the village.
-Dry waste from community bins is collected weekly for recycling, and cloth bags are distributed in the local community every 3 months as part of a ‘Plastic Eradication Programme.’ CFL bulbs are distributed within the community as well for household use.
-Staff members lead monthly clean up drives and conduct periodic environmental education classes in adopted local schools (students also take field trips to study Coconut Lagoon’s green practices). Earth Hour awareness programs are also held within the local community, as are community tree plantation drives.
Engagement in Sustainable Tourism Initiatives
-Guests are encouraged to participate in biodiversity appreciation initiatives, and an in-house naturalist at the Interpretation Centre can educate them on the ecology of the region.
-Guests are also encourage to participate in the organic rice plantation and cultivation activities as well as the tree plantation initiatives in the surrounding area.
Biodiversity Preservation Initiatives
-Coconut Lagoon has a total of 1101 trees representing 90 different species on its property.
-It also has a butterfly garden with 17 different species and a fish sanctuary with 44 different species.
-Mangrove saplings have been planted along the waterside as an effort to restore rapidly disappearing mangroves as well as spread awareness about their importance to the community.
This report presents state wise emission factors for electricity generation as well as their respective AT&C losses. To enable accurate calculation of emissions by end users in each state the two factors are also combined to present an emission factor for end user consumption of electricity in each state in India. This report, brought out by cBalance Solution Pvt. Ltd., also highlights comparative emissions of all states taking into account each ones specific emission factor which with further analysis can be used as a tool for progressive national policy making in order to help India achieve its goal of 20-25% emissions reduction from 2005 levels by 2020.
1.1 STATE OF THE POWER SECTOR IN INDIA (2009-10)
Though the total ex-bus energy availability increased by 8.0% over the previous year and the peak met increased by 7.5%, there were still significant shortages in the country both in terms of both energy and peaking availability as given below:
Energy (MU)
Peak (MW)
Requirement
8,30,594
1,19,166
Availability
7,46,644
1,04,009
Shortage
83,950
15,157
% shortage of requirement
10.10%
12.70%
The energy requirement registered a growth of 6.9% during the year against the projected growth of 8.2% and Peak demand registered a growth of 8.5% against the projected growth of 8.2%.
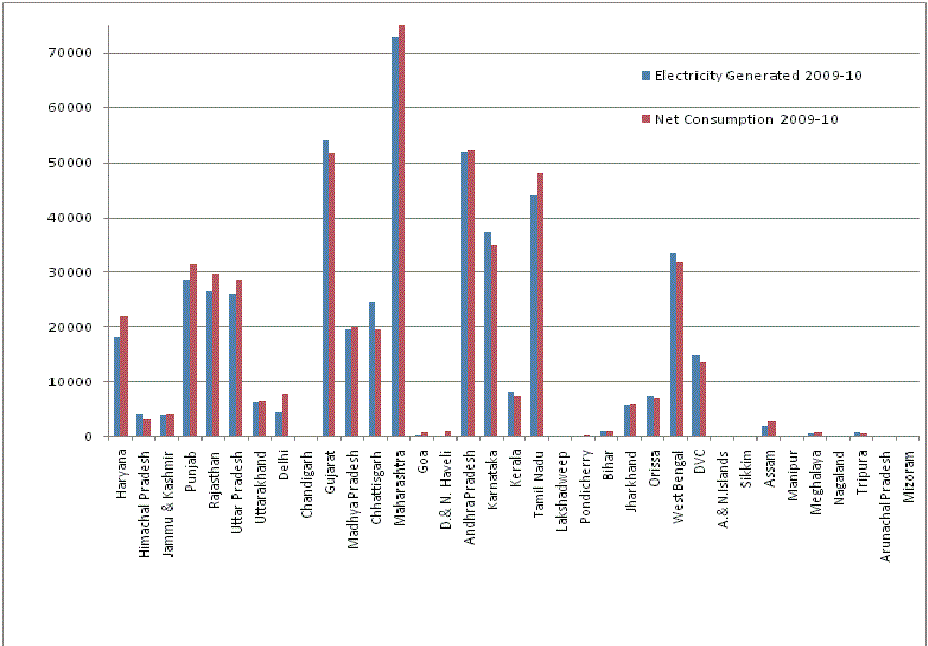
1.2 State wise contribution in electricity generation and consumption
About 50% of states & union territories are not self sufficient in electricity generation and are dependent on others states to fulfill their requirements.
Maharashtra is highest generator and consumer of electricity with Gujarat, Andhra Pradesh and Tamil Nadu close behind. Chattisgarh exports the largest amount of electricity at 4941 GWh while Tamil Nadu imports 4046 GWh which is the highest in the country.
2. Scope and Methodology
The data is sourced from CEA reports and calculations are done as outlined in the IPCC 2006 guidelines.
Electricity generation factor (kgCO2e/kWh)
(Emission from fossil fuels used for generation + Emission from electricity imported from other states – emission from electricity exported to other states) / Total electricity consumed by state
Fossil fuel electricity generation technologies include coal, thermal, Gas turbine generation and Diesel Generators.
Emissions from renewable energy technologies are considered to be zero.
AT&C Losses factor (kgCO2e/kWh)
(Total electricity generated by state x adjusted electricity generation factor of state x % of AT&C losses in the state)/ Total electricity consumed by state)
Adjusted generation emissions are Total electricity consumed * emission factor adjusted for import and export of electricity
The following results stand out from the above table:
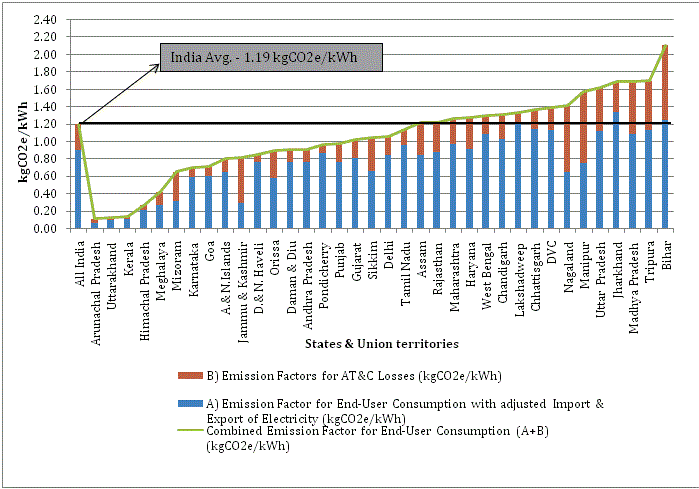
Jharkhand has the highest emission factor for generation at 1.21 kgCO2e/kWh and also the highest emission factor after adjusting for import and export of electricity which is 1.33 kgCo2e/kWh
2. Bihar has the highest AT&C losses in the system due to which it has the highest emission factor for AT&C losses which is 0.86 kgCO2e/kWh. This also results in it having the highest emission factor for end user consumption of electricity at 2.1 kgCO2e/kWh.
3. The average India electricity generation emission factor is 0.89 kgCO2e/kWh and average India AT&C loss emission factor is 0.30 kgCO2e/kWh.
4. States that import electricity are liable for the corresponding proportion of emissions of each state from where electricity is imported. Hence some states like Sikkim, Assam, Manipur, Nagaland in particular appear to be “dirtier” i.e. their emission factors are quite high because they are importing electricity from states which have a high electricity generation emission factor.
3.2 State wise end user consumption emission factor of electricity
Graph 1: State wise end user electricity emission factor
In the above graph we can see almost 45% of states have an end user emission factor that is higher than the India avg. emission factor of electricity generation.
In many cases we can see that states have a low adjusted emission factor for generation but due to high AT&C losses their end user emission factor is higher than the India avg. emission factor. This point is illustrated in detail in the graph below.
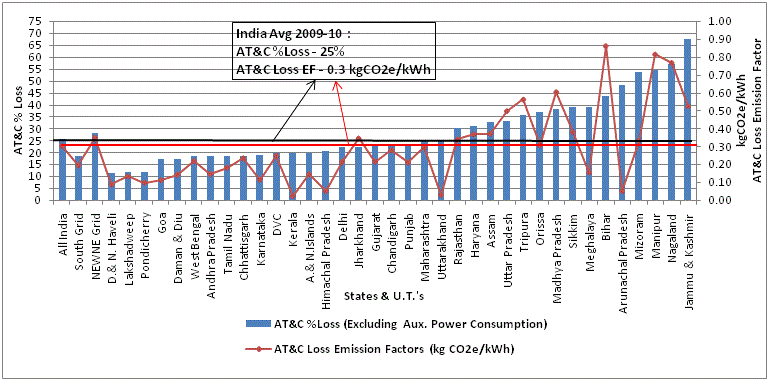
3.3 State wise AT&C losses and emission factors for AT&C losses
Graph 2: State wise AT&C % losses and AT&C loss emission factors
As shown above the India average AT&C % loss is 25%. Also there is a big variation in the % losses between the grids specifically such as the South grid and NEWNE grid.
Highest AT&C % loss of 67% is recorded from Jammu & Kashmir and the lowest one recorded from D.&N. Haveli which is 11%.
About 40% states have higher AT&C system losses than the India average which points to a huge potential to save electricity with up gradation of technology and proper maintenance of transmission and distribution systems. It is also noticeable that states with difficult terrain such as hills and forests have higher AT&C losses than other states.
Another important fact visible in the graph above is that the AT&C loss emission factor is not only dependant on the quantum of losses but also on the source of electricity generation. Hence a state with low AT&C losses but “dirtier” sources of electricity generation could still have an AT&C emission factor higher than that of a state with higher losses but cleaner sources of generation. For e.g. Arunachal Pradesh has extremely high losses of about 47% but since most of its electricity is generated through hydel power its AT&C factor is less than 0.1 kgCO2e/kWh. Whereas Jharkhand has losses of only about 23% but its AT&C emission factor is about 0.3 kgCO2e/kWh since most of its electricity is generated from coal.
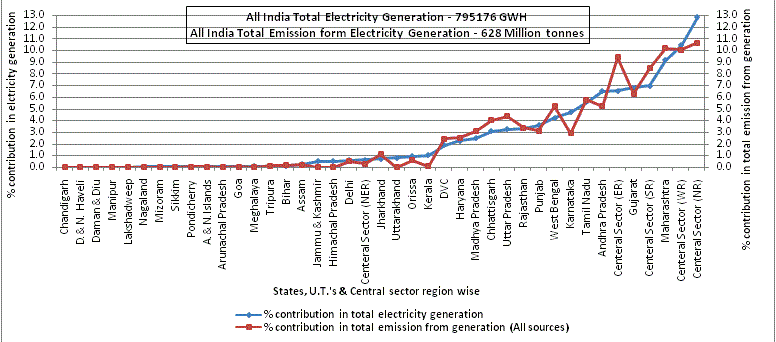
3.4 State wise contribution in electricity generation and emission from electricity generation
Graph 3: State wise % contribution in total electricity generation and % contribution in total emission from generation of electricity (all sources)
In the above graph we can see that a majority i.e. 23 states and UT’s contribute less than 1% each to India’s generation and emission stock. The majority generators are Maharashtra, & Gujarat and they are responsible for 9.2% and 6.8% of generation stock and 10.2% and 6.3% of emissions respectively.
Karnataka also has the lowest percentage of emissions of 2.9% with respect to it percentage of generation stock of 4.7% while Uttar Pradesh has the highest percentage of emissions of 4.3% over its percentage contribution to the generation stock at 3.3%.
4. Conclusion
A majority of emissions from the power sector are due to usage of coal as a primary medium for electricity generation (68%). There is a large potential to reduce emissions through usage of better quality of coal, more efficient technologies as well as moving to cleaner technologies such as thermal, hydro, solar etc. But these scenarios depend on various factors such as cost, geographical location, availability of raw materials etc and hence are hard to predict.
But as shown earlier, states with relatively clean generation technologies still have quite a poor end user emission factor due to major AT&C losses. This is a “low hanging fruit” opportunity for states to drastically improve their quality of electricity and emission factors. For e.g. if all states whose AT&C losses lie below the India avg. of 25% move up to atleast the average, an emission reduction of approximately 15 MTCO2e is possible. In the best case scenario if all states improve their efficiency of AT&C to the world average of 8.4% phenomenal savings of 115 MTCO2e are possible which is a reduction of about 67% of emissions due to AT&C losses. These steps can go a long way in helping India achieve its goal of 20-25% reduction in emissions over 2005 levels by 2020.
[1] Data Source : CEA – All India Electricity Statistics – General Review 2011
[2] Data Source : CEA – All India Electricity Statistics – General Review
2011
[3] Chandigarh is exporting more quantity than total generation so on the conservative principal assumed that one State whatever is importing within that it is consuming electricity embedded with higher emission.
Diu Electricity GHG EF (except AT&C Loss GHG EF) is same because it has been calculated on combined level due to non availability of quantity of exported and imported electricity.
[5] Sikkim is exporting more quantity than total generation so on the conservative principal assumed that one State whatever is importing within that it is consuming electricity embedded with higher emission.