

IIM(A)’s CHAOS 2010 Annual Cultural Festival’s Carbon Footprint Calculation
Posted OnThis blog post summarizes the carbon footprint calculation (i.e. an inventory of the total Greenhouse Gas Emissions (GHGs) that contribute to Climate Change resulting from direct and indirect resource consumption through event activities) of the IIM(A)’s CHAOS 2010 annual cultural festival, which was contracted to Eliminate Carbon Emissions Pvt. Ltd by the festival’s Organizing Committee.
Goals:
The project goals were to determine, with the great degree of accuracy possible, the following for CHAOS 2010:
- Total Resource Consumption Inventory
- Total Carbon Footprint
- Resource consumption activity-differentiated Carbon Footprint
- Stakeholder-differentiated Carbon Footprint
- Per-participant Average Carbon Footprint
Boundaries for the Carbon Footprint Calculation process were defined in consultation with CHAOS 2010 Management. Defining boundaries involved two key-decision making areas: activities to be included (i.e. defining a comprehensive yet manageable set of resources who’s consumption was to be inventoried) and stakeholders to be considered as part of the organization’s footprint (i.e. defining which sets of peoples/groups/functions are to be included within the footprint boundary).
Scope:
Since Carbon Footprint Reporting for events in India is not mandated by either the Indian Government or the United Nations Framework Convention for Climate Change (UNFCCC), and CHAOS 2010’s initiative to address its Climate Change Impacts is purely voluntary, there was no set of pre-established guidelines for boundary definition to be followed. Thus, the globally accepted methodologies for National GHG Emissions Reporting (adopted by India as part of the Kyoto Protocol) laid down by the IPCC (Inter Governmental Panel on Climate Change) as part of the 2006 Guidelines were used for guidance wherever appropriate. However, given the unique nature of this event, the overall methodology reflected a confluence of standard protocols and event-appropriate approaches which provide an accurate estimate of the Climate Change impact of a unique cultural and live-entertainment event, which CHAOS represents.
Activity Boundaries:
- Contributing Directly to Carbon Footprint: Cooking Fuel Consumption, Vehicular Fuel Consumption (these are activities where an individual or business has direct control over the amount of activity and the emission coefficient through technological choices)
- Contributing Indirectly to Carbon Footprint (Primary Importance): Electricity Consumption, Water Consumption (these are activities where an individual or business has direct control over the amount of activity but not the emission coefficient through technological choices)
- Contributing Indirectly to Carbon Footprint (Secondary Importance): Transportation (Rail, Road, and Air Travel), Food & Beverage comprising of Meat, Seafood, Dairy, Rice, Alcoholic and Bottled Water/Soft Drink Beverage Consumption, Waste Generation, Plastic, Paper and Other Consumables (these are activities where an individual or business can be considered to not have direct control over the amount of activity nor the emission coefficient through technological choices)
Stakeholder Boundaries:
- CHAOS 2010 Organization
- Event Performers
- Event Participants
Life-cycle Boundaries:

Methodology
The research methodology followed for the project centered around the idea of dissecting the event operations and disaggregating the consumption of resources to understand the consumption patterns ‘ground-up’. While this approach was more time-consuming, as opposed to tracking all activities through a ‘centralized’ approach, it helped construct a detailed footprint-map that would be invaluable as an analysis tool to identify stakeholder contributions to overall footprint. This data was then refined and scrutinized for inaccuracies when data appeared to be erroneous.
Results
The total carbon footprint of CHAOS 2010 for the activities and stakeholders presented previously is estimated to be 29.7 tons of CO2e.

Table 4 presents the contributions to the total carbon footprint differentiated by scope. Items identified as ‘not known’ represent data that was unavailable for analysis due to constraints encountered by data gathering personnel, and underlined quantities represent activities where consumption was estimated based on an assumed per-participant consumption quantity.
Figure 7 displays the percentage of overall GHG emissions per activity. Auto-rickshaw and flights were the two largest contributors at 29% and 21%, respectively.

Table 5 displays the GHG emissions per stakeholder. The participants, at 50%, were by far the largest contributors.
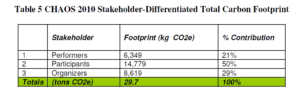
Figure 2 displays the same results in a pie chart.
")
Conclusions
Preemptively, Participant Travel and Waste Generation Footprints may be mitigated in future events through:
- provision of mass-transit based systems, such as fuel-efficient or alternative fuel (CNG) buses, to transport participants from pre-determined nodal locations in the surrounding areas of IIM(A) to the event.
- waste management principles centered around waste segregation, organic waste composting, and waste recycling must be adopted in conjunction with the rigorous participant awareness effort to ensure minimal waste is sent to landfills as an outcome of CHAOS.
Finally, based on the above analysis presented earlier, it is recommended that IIM(A) offset a significant percentage of the footprint of CHAOS 2010 (29.7 tons of CO2e) through ‘domestic’ action. It is recommended that IIM(A) review its monthly electricity consumption and set a achievable ‘percentage-reduction’ target for the first quarter during the new Academic Year beginning in mid-2010 to ‘offset’ at least 50% of the 19,192 units (i.e. 10,000 units).