

Neemrana Fort Palace Hotel Carbon Footprint
Posted OnThis blog post summarizes the carbon footprint calculation conducted by Eliminate Carbon Emissions Pvt. Ltd to measure the greenhouse gas emissions of the Neemrana Fort Palace Hotel (pictured below).

Goals and Scope:
The project goals were to determine with the great degree of accuracy possible the total resource consumption inventory, total carbon footprint, and the activity-differentiated carbon footprint of the Neemrana Fort Palace Hotel’s operations. The activity boundaries were categorized as Scope 1, 2, and 3 emissions, with the results displayed in the following table.

The stakeholders were defined as the primary realizer (Neemrana Fort) and the fruit jam production facility (Nainital). While many activities resulted in direct emissions (Scope 1), some resulted in indirect emissions through the generation of electricity (Scope 2), and the emissions caused by the production of goods used (Scope 3) must be included as well in a GHG inventory. The emissions of the latter group were calculated using the life cycle assessment.

Results:
The following table presents the extrapolated aggregated resource consumption inventory for the Neemrana Fort Palace Hotel.
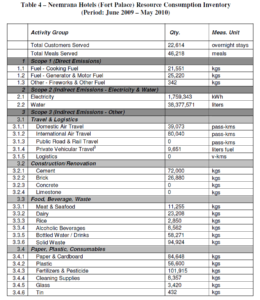
This resource consumption resulted in a total of 3,282 tons CO2e of 0.145 tons CO2e per stay from the period of June 2009 to May 2010. The results, categorized by activity, are displayed below.

As is obvious from the results, the vast majority of the greenhouse gas emissions came from the generation of electricity (83.5%). While nothing else came close, the GHG emissions from water (2.3%), generator usage (2.5%) and meat and seafood (2.6%) were also significant. Food, beverage, and waste as a category contributed 6.2% of the total emissions. The same results are displayed in the pie chart below.

Conclusion:
With electricity generation being responsible for so much of the hotel’s GHG emissions, efforts to reduce these emissions should focus on reducing electricity consumption. Staff and guests can work together to use less electricity through a number of voluntary (or mandatory) measures.
The original report can be read here.