“What is ‘enough’ in construction and even in life in general? What are we looking at in terms of impact when we construct a massive glass building in the middle of tropical cities like Pune or Mumbai or Bangalore? Are we just constructing something that gives us a panoramic view of the city and serves no other function?Isn’t this similar to spending crores on making an oven and then spending crores more to refrigerate it?”
These are the questions Mr. Nilesh Vohra, a young builder of Kanchan Developers, Pune was asking himself after a conference on ‘Defaulting Green’ in Kerala a few years ago. Nilesh is part of theGreen Buildings Committee of the Pune chapter of a nationally recognised builders association in Indiaand met inspiring green building consultants and developers through this forum. These are his initial manoeuvres into responsible construction practices.
Nileshs’ questions draw attention to the need for constructing buildings that are not solely driven by social notions of a ‘premium’ building (in this case, glass buildings), but also consider the social, economic and environmental implications of designing such buildings, which when not considered are detrimental to society and the environment as a whole.
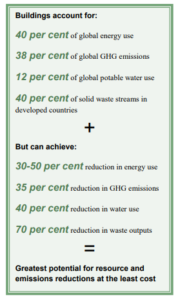
Why should the building economy consider moving towards green building construction, immediately? [footnote-(fn1)] In an era of human-induced climate crisis (fn2), we need to limit global warming to less than 1.5°C above pre-industrial levels, since estimates state that an increase in temperatures beyond 1.5°C will accelerate the climate crisis, resulting in increased unpredictable and uncontrollable occurrence of disasters such as floods, droughts, biodiversity loss, cyclones, etc. These episodes impact vulnerable sections of society in-equitably; not only are those from economically poorer backgrounds impacted first, but women, children, the elderly and sick are also vulnerable. Everyone, irrespective of who we are, will bear the consequences of climate collapse. The damage to buildings and other property, goes without saying, too. In order to avoid such damage, climate scientists caution towards reducing our greenhouse gas (GHG) emissions by 45% before 2030 and reaching net-zero emissions by 2075. The role of the building economy in contributing to GHG emissions and its potential to mitigate it are stated in the image (UNEP, 2012).
If constructing a ‘safe’ building is a non-negotiable value , considering the implications of the building economy on the environment, can green buildings be an option or are they a necessity?
According to India Brand Equity Foundation (2018), the number of Indians living in urban areas will increase from 434 million in 2015 to about 600 million by 2031, increasing the demand for residential and commercial buildings, both. Recognising the projected increase in construction activities, there seems to be ample opportunity to move towards responsible green building construction. Easy to say “Construct green buildings.” but how do we go about constructing these? What are the steps we have to take to implement these ideas in reality? How do we encourage and support the likes of Nilesh Vohra in making these a priority, amidst all the other logistical and bureaucratic challenges of building in these times? Based on our experience with carbon footprinting and ongoing dialogue with stakeholders contributing towards building construction, we offer some perspective that can facilitate the move forward.
Carbon Footprinting: A means towards responsible construction
What is carbon footprinting and how is it useful? Carbon footprinting is a measurable, verifiable and comparable instrument that entails measuring the carbon emissions during different operations and activities, in this case, building activities. This supports identifying alternatives to reduce emissions and where these would be most effective, thereby minimizing the negative impacts of construction on the environment. By quantifying carbon reduction efforts in building construction, meaningful and comparable information can be shared with building sector counterparts as well as potential buyers creating a base of evidence and commitment towards responsible construction. Carbon footprinting of building projects is a means for builders to begin demonstrating care for the larger world we belong to.
Just as one would not simply measure blood sugar levels of a diabetic without the intent to reduce them, responsible building, therefore, does not end with measuring the carbon footprint of a project. Incorporating actionable steps to mitigate emissions that are avoidable is the most important part.
The cBalance Carbon Footprint Experience
We supported carbon footprinting of the Royal Orange County Residential Housing Project as well as for two townships of Lohegaon and Zandewadi in Pune, respectively. Besides this, internal capacity building and skill development for the Orange County Foundation team was conducted to equip them with skills for calculating the carbon footprint of their construction projects. [Links to detailed reports of the three projects mentioned, are given in a box below. An overview of learnings from engagement with carbon footprint projects is provided at the end of this section, too.]
In the case of Orange County, a comparison was made between their previous projects and the Royal Orange County (ROC) Residential Housing Project which incorporated low carbon efforts such as eco-friendly architectural design buildings, renewable energy, waste management, wastewater management and low-carbon embodied construction and building materials. The calculation of the carbon footprint of the construction phase by the Orange County team revealed 15% lower emissions for the ROC construction compared to their previous projects. It should also be noted that Orange County incorporates sustainable principles in its construction projects by default and comparing the life cycle carbon footprint (fn3) of the ROC with other builder projects in Pune would probably demonstrate a much larger difference in emissions.
In the case of Lohegaon and Zandewadi townships in Pune, Maharashtra, we were asked to conduct carbon footprinting at the request of VK:e environmental, an architecture consultant. The project builders were required to submit a carbon footprint projection report including measures they would undertake to mitigate emissions to the State Environment Committee (SEC), Maharashtra prior to the start of the project. At the time, there wasn’t a standardized protocol available for township carbon footprinting (currently a GHG Protocol for Cities is widely used), so CB used multiple protocols to ensure quality measurements. This was undertaken considering that multiple iterations of footprinting using different protocols would lead to similar conclusions which would strengthen belief in the mitigation recommendations that would be suggested.
Following were the findings after conducting life-cycle carbon footprints of the two townships:
Township
Emissions
Mitigation Potential
Business As Usual (BAU)
Low carbon scenario
Lohegaon
3.51 million ton CO2e
2.48 million ton CO2e
1.02 million ton CO2e
Zandewadi
3.15 million ton CO2e
2.24 million ton CO2e
0.90million ton CO2e
Recommendations were conveyed to enable the builders to incorporate low carbon measures during the building process. Few of the recommendations that were suggested include: 1. Using natural afforestation methods rather than conventionally used plantation-forestry methods to compensate for the carbon absorption capacity that would be lost due to irreversible damage caused to the land on which the construction would occur. This recommendation suggested planting native trees and using the Miyawaki method of afforestation. 2. Reducing energy consumption by integrating passive design techniques such as the use of thermal mass to reduce heat gain, insulating materials or cavity walls, appropriate shading strategies for fenestration, low-U glazing, low-E films, and heat-reflective paints. 3.Inclusion of structure and radiant cooling systems within all floor and ceiling slabs to mitigate solar heat gain through rooftops and walls. 4. Designing flats in a manner that enables integration of natural refrigerant-based split ACs should the flat owners choose to install an AC.
Illustrations of Passive cooling strategies.
In comparing the projects; Orange County through implementation of low carbon measures actually demonstrated mitigation gains, whereas in the case of the two townships only the potential mitigation gains were revealed. Thus, while we participated in SEC hearings to encourage the SEC to approve the carbon footprint report and clear the township projects only if the builders take steps that align with the recommendations made, this was the extent of our influence. It still remains the purview of the SEC and other industry boards/ government authorities to compel builders to implement actionable steps towards reduction, compared to BAU construction.
Way forward
If the potential for environmental safeguarding during construction is no longer in question, then other factors must influence the decision to do so. What would make it accessible and worthwhile for builders to carry out these activities? According to Nilesh two critical obstacles for builders are the lack of investment in the sector and the lack of demand from end-users. For both, carbon footprinting presents itself as a step towards addressing these gaps.
An open disclosure tool, similar to other online tools, requires users to merely submit relevant data, which is then automatically processed to display the final results. Such a tool would enable multiple builders to present their carbon footprint calculations which would essentially create a feedback loop that shows where buildings can undertake at least the well-known measures to control carbon emissions such as using local materials, ensuring energy reduction during the operations phase, conservation etc. A life cycle carbon footprint additionally shows not only the savings at the time of construction but also the potential future energy and emissions savings (during occupation). Last, but definitely not least, it also shows where sustainable solutions pay back over time even those that may initially cost more. With such data it is possible to show investors and government and regulatory bodies from the local municipal level right up to the national and international levels, that such benefits can and should be tied to decision making and evidence-based policy making that favours and rewards responsible construction.
CBalance can create an affordable, sensitive and user-friendly tool and would invite industry associations such as the Confederation of Real Estate Developers’ Associations of India (CREDAI) to collaborate in this to encourage an increasing number of builders to voluntarily engage in carbon footprinting. This, along with recommendations based on the marginal abatement cost curve, can give builders a range of emissions mitigation opportunities from the least cost option to the highest cost. Additionally, our experience with building in-house capacity for carbon footprinting itself with the Orange County team showed that this too was not difficult. Thus, we recommend using a standard protocol for measurement and coupling in-house capacity building and engagement with consultants who are experienced in the field, to provide appropriate mitigation measures.
At this stage, it is in the collective hands of the builders to push for responsible construction processes at a larger scale, benefitting both, the building economy and the planet as a whole. If they have the vision and will to do so, carbon footprinting and cost-efficient sustainable alternatives like passive design techniques can easily replace ecologically destructive and expensive practices like air-conditioned glass buildings. Builders like Orange County have found ways to translate the wide variety of benefits it holds for residents and the wider community. Ultimately, raising the level of demand for responsible construction from multiple quarters can make shared responsibility and accountability a grounding and enlivening force for the building economy rather than an unwanted burden to be passed off or signed off on at the first opportunity. It will take many more Orange Countys and many more young builders like Nilesh to tip the scales and make sustainable the default. Whether you’re a builder, business person, government official, concerned consumer or citizen, at this juncture in time with climate chaos knocking at the doors of each one, which way you choose to step or what you choose to put your weight behind may change the course of not just your life but the nation and the planet too.
(1) A green building incorporates design techniques, materials and technologies that minimize its overall impacts on the environment and human health. This is achieved by better siting, design, material selection, construction, maintenance, removal, and possible reuse. Main outcomes are minimum site disruption, reduced fossil fuel use, lower water consumption, and fewer pollutants used and released during construction, occupation and disposal of the building. (UNESCAP, 2012)
cBalance has been engaging with Wipro, an Indian Information Technology Services Corporation, to estimate their GHG emissions from air travel since 2015.
The objective of the project has been to estimate GHG emissions from air travel, analyze Wipro’s flying patterns, estimate possible reductions in GHG emissions and recommend strategies to reduce GHG emissions.
The analysis was adhered to GHG Protocol’s Corporate Standard, accompanied by IPCC Guidelines 2006 to calculate airline specific emission factors (insert footnote)
Following the equation:
GHG Emissions = Activity Data x Emission Factor
Here, the Activity Data was the distance between Airport A to Airport B, calculated using great circle equation.
Emission factor was given in terms of kg CO2e / pax-km for each airline, distinguished based on whether the flight was International or Domestic and whether the flight was short, medium or long haul (this was determined based on the distance).
For FY 2014-2015 estimated GHG emissions were 170.1 thousand tonnes CO2e, with 1,269.8 million pax-km traveled across 5.0 lac flights
For FY 2015-2016 estimated GHG emissions were 152.9 thousand tonnes CO2e, with 1,134.4 million pax-km traveled across 4.7 lac flights
During these two cycle of analysis, other than estimating the GHG emissions from air travel, the major emphasis was on quantifying reduction potential and study reduction strategies. This was achieved by modeling two scenarios :
Best-In-Class Switch :
The goal of this scenario was to determine, for a given flight, the best airline in terms of emission factor ranking for its specified route. This helped us and Wipro quantify reduction potential just by switching over to a more efficient airline.
The estimated GHG emissions reduction from Best-In-Class switch for FY 2014-2015 were 59.9 thousand tonnes CO2e and for FY 2015-2016 were 36.9 thousand tonnes CO2e
Multi-stop to Non-stop Switch :
The goal of this scenario was to determine possible reductions in GHG emissions switching from a multi-stop flight to a non-stop flight.
The estimated GHG emissions reduction from Multi-stop to Non-stop switch for FY 2014-2015 were 19.4 thousand tonnes CO2e and for FY 2015-2016 were 11.7 thousand tonnes CO2e
In total, 79.3 thousand tonnes CO2e and 48.6 thousand tonnes CO2e reductions were estimated respectively for FY 2014-2015 and FY 2015-2016
A white paper titled Reducing Air Travel Emissions can be read here, where we have ranked airlines based on their GHG Emission Factor.
FY 2016-2017 & FY 2017-2018
For FY 2016-2017 estimated GHG emissions were 130.2 thousand tonnes CO2e, with 923.7 million pax-km traveled across 2.1 lac flights
For FY 2017-2018 estimated GHG emissions were 116.5 thousand tonnes CO2e, with 836.8 million pax-km traveled across 1.9 lac flights
Since the recommendations of flying the best-in-class airline, flying non-stop over multi-stop and choosing to travel via railways and/or use video calling services were already implemented, during these cycle only emission estimation was conducted on the business unit level.
For future development, the goal is to implement emissions and a financial budgeting system with respect to flying on a business unit level with the idea that it would create responsible air travel amongst employees.
Details on the Business Units wise emissions for FY 2016-2017 can be viewed here.
Furthermore, click here to view a comparison between Economy vs Business Class emissions between FY 2016-2017 and FY 2017-2018
Wipro, an Indian IT services multinational company desiring to become greener, commissioned cBalance to calculate its carbon footprint from business air travel so that strategies could be implemented to reduce these emissions. Wipro has an international presence and a wide geographic base and, thus, must use air transport in order to meet the needs of its clients. In the 2013-14 financial year, Wipro reported 103 thousand tons of CO2e GHG emissions from business travel, which was 13% of its total! Here lied a great opportunity for Wipro to substantially reduce its carbon footprint. So we set out to:
• estimate the carbon emissions factors for domestic and international airlines used by Wipro in 2014-15
• estimate a GHG inventory of Wipro’s business air travel based on the GHG Protocol Corporate Accounting and Reporting Standard,
• make a rankings index of domestic and international airline carriers sorted by their GHG emissions factors,
• recommend a best-in-class air carrier for each sector of company air travel,
• model choices that could reduce GHG emissions (choosing the best airline, reducing the number of stops in a journey)
Not only would this be useful for Wipro, the results of the study could be potentially used by the public at large to reduce their own carbon footprints by simply by making the right decision at the time of booking a flight.
Methodology:
The scope of the project covered all airline business travel, international and domestic, of Wipro during the 2014-15 fiscal year: nearly 500,000 flight legs and about 1.3 billion passenger-km traveled. While about 60% of the flights were domestic, over three quarters of the distance traveled was from international flights.
The GHG emissions inventory was taken following the GHG Protocol’s Corporate Standard, which covers the accounting and reporting of the six greenhouse gases following the Kyoto Protocol: carbon dioxide (CO2), methane (CH4), nitrous oxide (N2O), hydrofluorocarbons (HFCs), perfluorocarbons (PFCs), and sulphur hexafluoride (SF6), and requires adherence to the principles of relevance, completeness, consistency, transparency, and accuracy. Only the first three greenhouse gases, carbon dioxide (CO2), methane (CH4), nitrous oxide (N2O), are considered, as emissions of the other three were below the materiality threshold as defined by the ‘completeness’ principle. Operational boundaries have been specified according to the standard, which entails categorizing emissions as either direct or indirect emissions and choosing the scope for indirect emissions. The measured unit of reference flow is passenger-km of air travel and the unit of analysis is Metric Tonne of CO2e.
Wipro provided the raw data set (flights, airport codes, and carrier codes) and collection began by devising and administering a list of data needs identified by the Standard. Domestic short-haul and long-haul flights were defined as shorter and longer than 500 km, respectively, and international short-haul flights as up to 2,000 km, medium-haul flights as between 2,000 and 5,000 km, and long-haul flights as greater than 5,000 km. cBalance corrected errors and invalid entries in these data.
To develop emission factors, LTO (landing/takeoff) and cruise mode emissions were calculated for all aircraft models. Next, best-case per-passenger emission factors for finite distances were derived for every aircraft model (using maximum passenger capacity and load factor of 1). The same was done for additional finite distances on every aircraft model. Then, the per-passenger emissions for finite distances for each airline was calculated by summing the LTO and cruise-mode emissions (accounting for weighted average airline passenger capacities, airline-wide passenger load factors, and passenger to freight ratios). Finally, the same was done for additional finite distances for each airline. Unfortunately, the relative frequency of operation or share of annual passenger-kms performed by a given aircraft model in an airline’s fleet could not be taken into consideration due to the unavailability of the necessary data regarding domestic airline operations. Incorporating such statistics to arrive at a weighted average would provide a more rigorous approach.
Scenario Modelling:
cBalance also modelled two different scenario comparisons. The first compared the baseline to the best-in-class and found that if international flights were switched to the best-in-class scenario, it would result in savings of 41% of GHG emissions. For all Wipro’s international flights, the total savings would be 70.44 thousand tonnes of CO2e emissions. For domestic US flights, the best-in-class scenario results in 37% savings (7.47 thousand tonnes), and for domestic Indian flights the savings are 20% (3.92 thousand tonnes). The second compared multi-stop to non-stop flights and found that for international flights, 25% savings resulted from using non-stop flights, and for US domestic flights, the savings were 50%.
Conclusions:
From the fourth quarter of the 2015-16 fiscal year to the first quarter of the next, Wipro reduced the number of segments flown by 8.7%, but GHG emissions decreased 30% cumulatively and 23% per segment. Wipro was able to achieve such huge emission reductions by merely flying 7% fewer multi-stop segments and choosing ‘cleaner’ airlines.
Based on these findings, cBalance recommends that if the difference between the two airlines is less than 15%, pick the non-stop flight on the ‘dirtier’ airline instead of a flight on a ‘cleaner’ airline with a layover. If the difference is greater than 15%, on the other hand, pick a flight on a ‘cleaner’ airline with a layover as opposed to a non-stop flight on a ‘dirtier’ airline.
Air travel is a highly unsustainable activity that should be avoided when possible. Companies are pledging to take advantage of the teleconferencing capabilities enabled by our age of high speed internet to avoid unnecessary face-to-face meetings. When it is impossible to avoid such flights, companies and individuals can choose the optimal airline, reduced number of stops, and economy class, to reduce their GHG emissions. Something as easy as picking a non-stop flight can save dozens of kilograms of CO2e emissions. For some perspective on what that means, a large tree breathes about 12 kilos of CO2 a year. This is an easy way to reduce one’s carbon footprint.
This report presents state wise emission factors for electricity generation as well as their respective AT&C losses. To enable accurate calculation of emissions by end users in each state the two factors are also combined to present an emission factor for end user consumption of electricity in each state in India. This report, brought out by cBalance Solution Pvt. Ltd., also highlights comparative emissions of all states taking into account each ones specific emission factor which with further analysis can be used as a tool for progressive national policy making in order to help India achieve its goal of 20-25% emissions reduction from 2005 levels by 2020.
1.1 STATE OF THE POWER SECTOR IN INDIA (2009-10)
Though the total ex-bus energy availability increased by 8.0% over the previous year and the peak met increased by 7.5%, there were still significant shortages in the country both in terms of both energy and peaking availability as given below:
Energy (MU)
Peak (MW)
Requirement
8,30,594
1,19,166
Availability
7,46,644
1,04,009
Shortage
83,950
15,157
% shortage of requirement
10.10%
12.70%
The energy requirement registered a growth of 6.9% during the year against the projected growth of 8.2% and Peak demand registered a growth of 8.5% against the projected growth of 8.2%.
1.2 State wise contribution in electricity generation and consumption
About 50% of states & union territories are not self sufficient in electricity generation and are dependent on others states to fulfill their requirements.
Maharashtra is highest generator and consumer of electricity with Gujarat, Andhra Pradesh and Tamil Nadu close behind. Chattisgarh exports the largest amount of electricity at 4941 GWh while Tamil Nadu imports 4046 GWh which is the highest in the country.
2. Scope and Methodology
The data is sourced from CEA reports and calculations are done as outlined in the IPCC 2006 guidelines.
Electricity generation factor (kgCO2e/kWh)
(Emission from fossil fuels used for generation + Emission from electricity imported from other states – emission from electricity exported to other states) / Total electricity consumed by state
Fossil fuel electricity generation technologies include coal, thermal, Gas turbine generation and Diesel Generators.
Emissions from renewable energy technologies are considered to be zero.
AT&C Losses factor (kgCO2e/kWh)
(Total electricity generated by state x adjusted electricity generation factor of state x % of AT&C losses in the state)/ Total electricity consumed by state)
Adjusted generation emissions are Total electricity consumed * emission factor adjusted for import and export of electricity
The following results stand out from the above table:
Jharkhand has the highest emission factor for generation at 1.21 kgCO2e/kWh and also the highest emission factor after adjusting for import and export of electricity which is 1.33 kgCo2e/kWh
2. Bihar has the highest AT&C losses in the system due to which it has the highest emission factor for AT&C losses which is 0.86 kgCO2e/kWh. This also results in it having the highest emission factor for end user consumption of electricity at 2.1 kgCO2e/kWh.
3. The average India electricity generation emission factor is 0.89 kgCO2e/kWh and average India AT&C loss emission factor is 0.30 kgCO2e/kWh.
4. States that import electricity are liable for the corresponding proportion of emissions of each state from where electricity is imported. Hence some states like Sikkim, Assam, Manipur, Nagaland in particular appear to be “dirtier” i.e. their emission factors are quite high because they are importing electricity from states which have a high electricity generation emission factor.
3.2 State wise end user consumption emission factor of electricity
Graph 1: State wise end user electricity emission factor
In the above graph we can see almost 45% of states have an end user emission factor that is higher than the India avg. emission factor of electricity generation.
In many cases we can see that states have a low adjusted emission factor for generation but due to high AT&C losses their end user emission factor is higher than the India avg. emission factor. This point is illustrated in detail in the graph below.
3.3 State wise AT&C losses and emission factors for AT&C losses
Graph 2: State wise AT&C % losses and AT&C loss emission factors
As shown above the India average AT&C % loss is 25%. Also there is a big variation in the % losses between the grids specifically such as the South grid and NEWNE grid.
Highest AT&C % loss of 67% is recorded from Jammu & Kashmir and the lowest one recorded from D.&N. Haveli which is 11%.
About 40% states have higher AT&C system losses than the India average which points to a huge potential to save electricity with up gradation of technology and proper maintenance of transmission and distribution systems. It is also noticeable that states with difficult terrain such as hills and forests have higher AT&C losses than other states.
Another important fact visible in the graph above is that the AT&C loss emission factor is not only dependant on the quantum of losses but also on the source of electricity generation. Hence a state with low AT&C losses but “dirtier” sources of electricity generation could still have an AT&C emission factor higher than that of a state with higher losses but cleaner sources of generation. For e.g. Arunachal Pradesh has extremely high losses of about 47% but since most of its electricity is generated through hydel power its AT&C factor is less than 0.1 kgCO2e/kWh. Whereas Jharkhand has losses of only about 23% but its AT&C emission factor is about 0.3 kgCO2e/kWh since most of its electricity is generated from coal.
3.4 State wise contribution in electricity generation and emission from electricity generation
Graph 3: State wise % contribution in total electricity generation and % contribution in total emission from generation of electricity (all sources)
In the above graph we can see that a majority i.e. 23 states and UT’s contribute less than 1% each to India’s generation and emission stock. The majority generators are Maharashtra, & Gujarat and they are responsible for 9.2% and 6.8% of generation stock and 10.2% and 6.3% of emissions respectively.
Karnataka also has the lowest percentage of emissions of 2.9% with respect to it percentage of generation stock of 4.7% while Uttar Pradesh has the highest percentage of emissions of 4.3% over its percentage contribution to the generation stock at 3.3%.
4. Conclusion
A majority of emissions from the power sector are due to usage of coal as a primary medium for electricity generation (68%). There is a large potential to reduce emissions through usage of better quality of coal, more efficient technologies as well as moving to cleaner technologies such as thermal, hydro, solar etc. But these scenarios depend on various factors such as cost, geographical location, availability of raw materials etc and hence are hard to predict.
But as shown earlier, states with relatively clean generation technologies still have quite a poor end user emission factor due to major AT&C losses. This is a “low hanging fruit” opportunity for states to drastically improve their quality of electricity and emission factors. For e.g. if all states whose AT&C losses lie below the India avg. of 25% move up to atleast the average, an emission reduction of approximately 15 MTCO2e is possible. In the best case scenario if all states improve their efficiency of AT&C to the world average of 8.4% phenomenal savings of 115 MTCO2e are possible which is a reduction of about 67% of emissions due to AT&C losses. These steps can go a long way in helping India achieve its goal of 20-25% reduction in emissions over 2005 levels by 2020.
[1] Data Source : CEA – All India Electricity Statistics – General Review 2011
[2] Data Source : CEA – All India Electricity Statistics – General Review
2011
[3] Chandigarh is exporting more quantity than total generation so on the conservative principal assumed that one State whatever is importing within that it is consuming electricity embedded with higher emission.
Diu Electricity GHG EF (except AT&C Loss GHG EF) is same because it has been calculated on combined level due to non availability of quantity of exported and imported electricity.
[5] Sikkim is exporting more quantity than total generation so on the conservative principal assumed that one State whatever is importing within that it is consuming electricity embedded with higher emission.
INTRODUCTION TO CARBON EMISSIONS IN THE CEMENT SECTOR IN INDIA:
Cement as a commodity plays a vital role in the growth of a nation since it is an essential raw material for concrete which is a key raw material in key sectors like infrastructure, construction, commercial and residential real estate. Globally, cement contributes about 5% of the total CO2 emissions. Concrete is the second most consumed substance on Earth after water. On average, each year, three tons of concrete are consumed by every person on the planet. In India, the cement sector is one of the prominent contributors to conventional as well as GHG emissions. Although there is no statutory obligation on companies to measure and report total air emissions in India, the preparation of air emission inventories can be useful in internal company benchmarking, public reporting, product profiles, and emerging emissions trading. In the near future, it is also possible that such inventories will encourage voluntary actions to promote energy efficiency and GHG emissions mitigations, especially in large, organized industrial sectors like cement
INDIAN CEMENT SECTOR AT A GLANCE:
India stands second in the cement production in world after China. The total installed capacity of India in 2009-10 was 236 MT in 2009–2010. In same year the cement production for India was 200.7 MT.
PROCESS DESCRIPTION:
Carbon dioxide (CO2) is emitted from both the chemical process and energy consumption associated with the manufacturing of cement. During calcination or calcining, calcium carbonate (CaCO3)(limestone) is heated in a cement kiln to form lime, a process that emits CO2 as a byproduct. This accounts for about 50% of all emissions from cement production. The resulting lime reacts in the kiln with silica, aluminum, and iron oxides present in the raw material to produce clinker. Clinker, an intermediate product, is mixed with a small amount of gypsum and/or anhydrite to make Portland cement. Indirect emissions from the burning of fossil fuels used to heat the kiln account for about 40% of emissions from cement. Finally, electricity used to power additional machinery and the transportation of cement account for the remaining 5-10% of the industry’s emissions. (Rubenstein)
SCOPE AND METHODOLOGY FOR CEMENT SECTOR INVENTORY:-
SCOPE
For this study 51 cement producing Indian companies have been analyzed. ‘Carbon emissions in the Cement sector in India’ have been calculated per ton of cement produced by each company from data available in their annual reports using the process shown in the diagram below. Emissions per ton of cement produced is known as the emission intensity of the company or also referred to as the emission factor. The following Scope 1, Scope 2 and Scope 3 activities as defined are taken into consideration.
FORMULA
Emission factor (TCO2e/Ton cement produced) = Total emissions in FY / Total amount of cement produced in FY
METHODOLOGY
Energy fuels comprise of various fossil fuels, wood, municipal waste, peat fuels.
Electricity purchased is the quantity of electricity purchased by a company from the grid.
Captive power generation is the self generation of electricity for meeting internal requirements. A company can produce electricity through various technologies like diesel generator, gas generator, steam generator etc. Depending on the technology and the fossil fuel used emissions from captive power generation is calculated.
In cases where company specific captive generation emission factors are not available an India average for that particular technology has been used
Non energy emissions are emissions resulting from the chemical processing of certain materials such as limestone and is obtained from one of the following sources of data as per the IPCC/GHG Protocol guidelines : clinker production, limestone production and cement production
Emissions from Raw material purchased include Scope 3 emissions which are attributed to a company when either limestone or clinker is purchased for use as a raw material in cement manufacturing.
RESULTS:
Company Name
Actual Production in ‘000 Tons
Total CO2e in ‘000 tonnes
TCO2e/ton cement production
Percentage intensity related to India Average Emission factor
A C C
Ltd.
21369.00
17522.58
0.82
0.96
Ambuja Cements Ltd.
18828.45
13368.20
0.71
0.83
Andhra Cements Ltd.
990.94
693.66
0.7
0.82
Anjani Portland Cement Ltd.
497.72
408.13
0.82
0.96
Barak Valley Cements Ltd.
207.92
176.73
0.85
1.00
Bheema Cements Ltd.
251.60
183.67
0.73
0.85
Binani Cement Ltd.
5280.00
4012.80
0.76
0.89
Birla Corporation Ltd.
5698.00
4615.38
0.81
0.95
Burnpur Cement Ltd.
74.92
39.71
0.53
0.62
Cement Corpn. Of India Ltd.
968.23
1103.78
1.14
1.33
Cement International Ltd.
78.73
37.79
0.48
0.56
Cement Manufacturing Co. Ltd.
401.41
622.19
1.55
1.81
Century Textiles & Inds. Ltd.
7583.22
7507.38
0.99
1.16
Chettinad Cement Corpn. Ltd.
4003.47
2882.50
0.72
0.84
Cochin Cements Ltd.
58.52
26.92
0.46
0.54
Dalmia
cement (Bharat) Ltd.
4074.00
3585.12
0.88
1.03
Deccan Cements Ltd.
1096.95
1217.61
1.11
1.30
Gujarat Sidhee Cement Ltd.
2034.19
2196.93
1.08
1.26
Heidelberg Cement India Ltd.
2660.67
1676.22
0.63
0.74
Hemadri Cements Ltd.
203.64
238.26
1.17
1.37
India Cements Ltd.
10494.00
8710.02
0.83
0.97
J K Cement Ltd.
4586.51
4540.64
0.99
1.16
J K Lakshmi Cement Ltd.
4156.76
3283.84
0.79
0.92
K C P Ltd.
807.65
654.19
0.81
0.95
Kakatiya Cement Sugar & Inds. Ltd.
258.86
308.05
1.19
1.39
Kalyanpur Cements Ltd.
676.00
594.88
0.88
1.03
Keerthi Industries Ltd.
280.11
296.91
1.06
1.24
Lafarge India Pvt. Ltd.
7851.20
4789.23
0.61
0.71
Madras Cements Ltd.
8030.00
6343.70
0.79
0.92
Mangalam Cement Ltd.
1637.00
1718.85
1.05
1.23
Meghalaya Cement Ltd.
555.98
489.26
0.88
1.03
My Home Inds. Ltd.
2984.34
2327.79
0.78
0.91
N C L Industries Ltd.
590.14
714.07
1.21
1.42
O C L India Ltd.
3035.00
1821.00
0.6
0.70
Orient Paper & Inds. Ltd.
3056.03
2750.43
0.9
1.05
Panyam Cements & Mineral Inds. Ltd.
433.03
506.65
1.17
1.37
Penna Cement Inds. Ltd.
4088.77
3679.89
0.9
1.05
Prism Cement Ltd.
2568.32
2439.90
0.95
1.11
Rain Commodities Ltd.
2372.30
1992.73
0.84
0.98
Rishi Cement Co. Ltd.
1.74
2.92
1.68
1.97
Sagar Cements Ltd.
1120.35
1557.29
1.39
1.63
Sainik Finance & Inds. Ltd.
37.61
32.72
0.87
1.02
Samruddhi Cement Ltd. [Merged]
10121.95
10020.73
0.99
1.16
Sanghi Industries Ltd.
1828.17
1919.58
1.05
1.23
Saurashtra Cement Ltd.
1285.92
1337.35
1.04
1.22
Shiva Cement
Ltd.
98.47
88.62
0.9
1.05
Shree Cement Ltd.
9371.92
7684.97
0.82
0.96
Shree Digvijay Cement Co. Ltd.
1010.66
899.49
0.89
1.04
Ultratech Cement Ltd.
17639.00
17991.78
1.02
1.19
Vinay Cements Ltd.
97.69
137.74
1.41
1.65
Zuari Cement Ltd.
3195.20
2556.16
0.8
0.94
Sum
180632.25
154306.96
0.85
ANALYSIS OF CARBON EMISSIONS IN THE CEMENT SECTOR IN INDIA:
The graph below shows us the emissions per ton of cement produced for each company as well as the emission intensity of the various companies as compared to the India average of 0.85 TCO2e/ ton of cement produced. We can see that about 55% of the companies i.e. 28 out of 51 have emission intensities higher than the India average. Cochin Cement Ltd. has the lowest emission factor of 0.46 TCO2e/ton while the company with the highest factor is Rishi Cement Ltd. at 2.92 TCO2e/Ton cement. The range of the intensity with respect to the average varies from 0.54 of Cochin Cement Ltd. to 1.97 of Rishi Cement Ltd.
Figure 1: Emission intensities of companies in the cement sector in India
DISTRIBUTION OF GHG INTENSITIES OF COMPANIES IN THE SECTOR:-
The distribution of emission intensities of the companies analyzed is shown below:
Figure 2: Distribution of emission intensities of companies in the cement sector in India
As visible in the graph above about half of the 51 companies have emission intensities in the medium range. There is quite an even distribution of companies with about a quarter in the above average range and a quarter in the below average range. The 12% of companies in the first bar can be termed as sector leader and set the benchmark for the rest of the industry. Second bar are above average but need some process related interventions to improve efficiency. The laggards are companies in need of major technology advances to improve efficiency and reduce emissions. Such a chart can help policy makers design specific policy initiatives to cater to companies in each range as well provide prioritize incentives based on the quantum of distribution.
METHODS FOR CARBON MITIGATION IN THE CEMENT INDUSTRY:-
Indirect emissions from burning fossil fuels to heat the kiln can be reduced by switching to such as natural gas, biomass and waste-derived fuels. These less carbon-intensive fuels could help reduce almost a quarter of overall cement emissions from 2006 levels by 2050.
Increasing efficiency of the production process so as to reduce the demand for fuel through technical and mechanical improvements will also help drastically reduce emissions. Steps such as switching from inefficienct wet ils to dry ones or regular preventive maintenance could help achieve emission reductions of upto 40%.
Reducing emissions from the calcination process means looking for an alternative to limestone. Blended cement made up primarily of coal fly ash and blast furnace slag replaces some of the limestone-based clinker with other materials. This could help reduce CO2 emissions by as much as 20%, but widespread use of blended cement is limited by other environmental regulations as these substitutes can contain toxic heavy metals; the limited availability of substitute material; as well as some building code restrictions since blended cement can take longer to set.
The final method of containing CO2 emissions is after they are produced through carbon capture and storage. In addition to traditional CCS methods, which are already employed in some power plants around the world, concrete producers can explore using their own product as a sink for CO2. Through the process of accelerated carbonation, CO2 penetrates concrete and reacts with calcium hydroxide in the presence of water to form calcium carbonate; the result is stable, long-term CO2 storage. As a mitigation technology, accelerated carbonation can be achieved by exposing freshly mixed concrete to flue gases with high CO2 concentrations. (Rubenstein)
CONCLUSION:-
There are 28 companies out of 51 in the cement sector whose emission factor is more than the India average per ton produced. If all of these companies improve their efficiency using the various methods mentioned above, to atleast the Indian average there will be a savings of upto 10.41 Million TCO2e. In a potential best case scenario, if all the other 50 companies perform atleast as well as the best in class, i.e Cochin Cement ltd. which has an emission intensity of 0.46 TCO2e/ton of cement produced, approximately 71.21 Million TCO2e can be saved. Such sector specific and company specific understanding of GHG intensities can be a useful tool for policy making in order to frame direct and target based incentives which will be necessary if India is to achieve its goal of 20-25% emission reduction over 2005 levels by 2020.
GLOSSARY
1) Scope 1: Direct air emissions from sources that are owned or controlled by the company These include direct process emissions (e.g. calcination of raw materials), direct stationary combustion in furnaces, diesel generator sets, etc., from fossil fuels, and mobile emissions from company-owned vehicles.
2) Scope 2: Indirect air emissions from the generation of purchased electricity consumed by the company 3) Scope 3: Other indirect air emissions from sources not owned or controlled by the facility like extraction and production of purchased materials, transportation of purchased fuels, clinker imports, and use of sold products and services
REFERENCES
(The Energy and Resources Institute (TERI),USEPA, 2005 • http://www.ibef.org/download/Cement_270111.pdf
http://www.ibef.org/download/Cement_270111.pdf
Calculating CO2 process emissions from Cement Production (Cement-based Methodology), Guide to calculation worksheet (October 2001) • Rubenstein, Madeleine – http://blogs.ei.columbia.edu/
This article is a simple “sustainability guide for the hospitality sector in India”. It will give an overview of the methods that can be taken by a hotel to chart a performance based sustainable growth path.
While a lot of hotels are taking positive measures to become environmentally friendly most of them are ad-hoc steps undertaken without any long term plan and data to substantiate the investment thus preventing hotels from being able to fully leverage their benefits. The main objective of these exercises is to be visible to the customers and project themselves as a green brand. This has led to “greenwashing” becoming a norm in the industry. Greenwashing can be defined as “The act of misleading consumers regarding the environmental practices of a company or the environmental benefits of a product or service”. The trap of greenwashing may enable firms to get short term returns on small investments but with a constant evolution of the knowledge base among customers, it compromises the integrity and the long term sustainability of the brand
Over time, green practices in the hospitality industry will become a baseline requirement, HCMI stands for Hotel Carbon Measurement initiative and is an effort to unite the hotel industry in order to calculate and communicate carbon emissions from guest rooms and meeting space in a uniform way. It is a simple method, available free of cost and a great starting point for any hotel looking to wet its toes on the path towards sustainability. It was developed by industry, for industry and will help customers especially corporate customers get accurate and consistent carbon footprint information from hotels globally. It is being pioneered by The International Tourism Partnership, World Travel & Tourism Council and 23 global hotel companies including well know ones such as Hyatt, Marriott, Hilton etc. It requires hotels to report emissions from only three key sectors which make up a bulk of the emissions namely: Fuel, Electricity and Outsourced Laundry. This will enable conscious individuals and companies to compare the basic sustainability of hotels globally and make informed decisions on how to spend their money; particularly as the cost of non-renewable energy continues to rise, regulatory pressure increases, and consumers become more demanding. Therefore, hotels with business models that revolve around green practices will have the strongest opportunity to achieve a competitive advantage by being ahead of the emerging sustainability curve. It would need hotels to move from a standard practice of proclaiming sustainability through words to a holistic approach that quantifies and certifies the operational performance of the hotel. As expected the international hospitality industry has taken the lead on this front. While doing so they have realized the benefits of these steps not only as a tool to better their image but one that also has a significant effect on their efficiency and as a result on their bottom line. This has resulted in the laggards in the industry having to pay dearly by spending large amounts of money to retrofit their hotels just to be competitive.
With the investment in India’s travel and tourism sector expected to grow at 8.8 % to INR 2,827.5 billion (US$ 63.7 billion) until 2021 there is a huge opportunity for hotels in India to learn from the industry around the world and invest early in a performance based system of sustainability that will help the hotel continuously improve its efficiency and performance.
The biggest challenge for the sector is that it is fragmented with the exception of a few big players. The smaller hotels are unable to visualize the larger impact of their activities. With limited knowledge and capability to invest in technological interventions it is absolutely necessary for them to accurately calculate the cost and resultant savings of various interventions so as to maximize their ROI. It is also equally important for these hotels to be able to accurately calculate and convey the savings and benefits to potential customers in a quantitative and qualitative manner to enable them to make informed decisions.
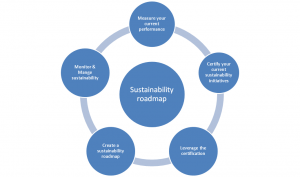
With a vision of enabling all: small & medium to large chain hotels across the country to undertake a wholesome approach to sustainability in a cost effective manner, outlined below is a realm of strategic steps that a hotel can take to put itself on the path to sustainable low carbon development.
Figure 1: The Sustainability roadmap
Measure your current performance: This is a process of defining the baseline for your hotel. It will help you see where you are currently placed and accordingly set goals. This does not require a hotel to have taken significant steps towards becoming sustainable. There are several frameworks that help you measure your baseline such as HCMI and The Green Signal Ecolabel.
green signal <Sustainability guide for the hospitality sector in India>
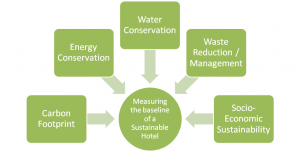
Hotels looking to get deeper into the realm of sustainability there is the Green Signal ecolabel which not only enables a hotel to measure its carbon footprint but also helps it measure sustainability parameters in energy conservation, water conservation, waste reduction and Social economic involvement. The method for measuring the carbon footprint of a hotel is also far more rigorous and includes parameters in Fuel, Electricity, Outsourced Laundry, Water, Waste Water, Corporate travel & F&B. This enables an organization to view its sustainability not only from the perspective of carbon but also from other key parameters like water and waste. Such a holistic study of a hotels sustainability enables it to prioritize areas of focus and set specific targets for improvement.
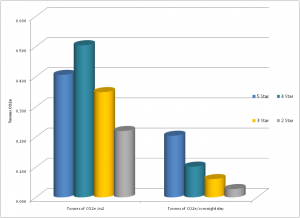
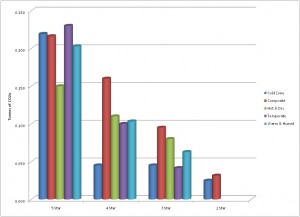
Certify your sustainability initiatives:. A common way of certification around the world has been in the form of ecolabels or other similar certifications from independent third parties. There exist in India quite a few certifications like LEED, GRIHA, IGBC etc for new development projects as well as a few international ecolabels especially for hotels. These standards are helpful to some extent but they fall short of providing a holistic solution to organizations as they are static, intent and compliance based rather than performance based. These methods advise you on what targets are to be achieved but do not help you select the appropriate interventions specifically for your project that will help you achieve those targets in a cost effective manner. A simple compliance system is not sufficient to accurately measure and convey the savings and the effect of the efficiency and conservation measures undertaken for the project to potential customers. The Green Signal Ecolabel while also providing a framework for sustainability measurement certifies applicants not only based on pre-specified targets but also on their relative performance to their peers in the sector. This is done by benchmarking the performance to specific peers who fall in the same sub groups such as hotel type, agro climatic zone and service grade. This encourages hotels to continually strive for improvement and keep pace with competitors, which improves the overall market stock. A survey conducted by BEE in partnership with USAID the results of which are shown below tells us that an average 5 star hotel can save between Rs.1-5 cr/year and abate between 500 to 5000 tonnes of CO2e/year depending on the agro climatic zone and size if it improves its energy efficiency to be in the Top 25% percentile.
Figure 3: co2 emissions of hotels by service grade
Figure 4: co2 emissions of hotels by service grade
Leverage the certification: After certification, hotels can take advantage of the credibility to reach out to current and potential customers and project themselves as a brand on the path towards sustainability. This includes branding all publicity collateral with the ecolabel, publishing a sustainability report, getting featured and listed on eco friendly travel portals frequented by conscious tourists. Hotels can also get innovative by initiatives such as conveying key performance data to guests in a non invasive manner at the appropriate point of contact such as ‘Our sensor taps save 3500l/year equivalent to 5% of our total water consumption shown in restrooms’, or using department specific data for staff training and internal goal setting. They can also go the extra mile and offer certified carbon neutral holidays to their guests.
Create a sustainability roadmap: Once a hotel has measured its baseline, taken some steps towards sustainability and gotten themselves certified they can opt for a in-depth analysis which will help them chart a short, medium and long term sustainability plan for their organization. Energy, Waste and Water audits can be carried out to assess resource intensive hot spots and deep opportunities for savings that can be harnessed by using eco-friendly alternatives for key products along with appropriate staff training. Innovative tools such as Marginal Green House Gases(GHG) Abatement Cost Curve (MACC) modelling can help prioritize green investments based on growth and investment patterns. MACC analysis is designed to discover the most cost-effective means of mitigating climate change impact by identifying the low-hanging fruit alternatives that must be pursued before embarking upon token or capital-intensive programs. MACC will help maximize tonnes of co2e abated for every Rs. spend and can be hotel or hotel chain specific or even community specific.
Monitor and manage sustainability: Once the opportunities have been identified and targets have been set a hotel will need to track its progress towards these goals. This can be done by empowering an individual or team within the organization to be the champions for change who will monitor and track progress. Cloud based carbon footprinting tools such as Footprint Reporter powered by an India specific emission factor database can also be effective methods to track sustainability projects and automatically generate statistics and reports which can help an organization effectively monitor its progress.
Each of these topics will be taken up in detail in the subsequent editions of this article.
In conclusion it is imperative for the hospitality industry to quickly realize that with increasing choice tourists are getting more discerning and environmentally conscious and are looking for brands with credible differentiators. Despite first-time guests basing their decisions on location, amenities and service, inclusive but non-intrusive sustainability initiatives have been shown to create positive perceptions in guests resulting in a higher recall rate. This results in increased customer loyalty as well as higher brand value of the hotel. To keep attracting tourists especially foreign tourists whose numbers are growing at 7.2% CAGR, hotels need to tap into new customer bases and create differentiators for themselves. Developing a short term and long term performance based sustainability strategy will enable an organization to identify a proactive low-carbon development pathway to be future ready.
For comments or feedback contact me on: udit@cbalance.in ( www.cbalance.in)